ICP-MS Heavy Metals Analysis in Hemp Food
Stephan Altmaier
Advanced Analytical R&D, Merck KGaA, Darmstadt, Germany
Abstract
A complete workflow has been developed for the analysis of a total of twelve heavy metals in hemp containing food products. This workflow includes the following:
- Sample homogenization utilizing a simple mortar and pestle approach
- Preparation of standard, blank and food sample solutions
- Preparation of calibration solutions using a heavy metal mix standard solution and single element standard solutions
- Conditions for rapid microwave sample digestion
- Setup of an ICP-MS system
- Analysis of heavy metal content of five different food samples containing hemp including determination of recovery rate
Introduction
Hemp (or: industrial hemp) and cannabis are strains of the Cannabis sativa plant differentiated based on their total delta-9-tetrahydrocannabinol (delta-9-THC) content (delta-9-THC and tetrahydrocannabinolic acid (THCA)). Cannabis sativa plant material that exceeds 0.3% wt/wt THC on a dry weight basis is considered to be marijuana (cannabis) under the US Controlled Substances Act. Industrial hemp is Cannabis sativa L. with a THC threshold below 0.3% (= % THCA x 0.877 + % Delta-9-THC). Definitions of hemp and cannabis are regulated in a specific manner in many parts of the world. In this work, various food products containing hemp have been analyzed, but all descriptions are valid for cannabis containing food as well.
Hemp is known to accumulate heavy metals such as lead, cadmium, arsenic, mercury, chromium or nickel in its roots, shoots, buds and seeds, and has been used for the remediation of contaminated soil (phytoremediation and phytoextraction).(1)(2)(3)(4) Due to potentially hazardous effects of these metals, this property may of course hinder the use of hemp in food or medical industries. In addition, product contamination can also occur during the manufacturing process. As a consequence, food or pharma products containing hemp must be tested for their heavy metal content.
This report describes the analysis of arsenic, cadmium, mercury, and lead (elements typically referred to as the “big four”) and chromium, barium, silver, selenium, antimony, copper, nickel, and zinc in hemp containing food samples by inductively coupled plasma coupled to mass spectrometry (ICP-MS). A premixed heavy metal standard solution containing the “big four” was utilized in combination with a set of eight single element standards – an approach covering a broad range of analytes. Depending on specific lab needs, it can easily be narrowed down to the “big four”. In total, five different food samples containing hemp were analyzed:
- Cereals (containing hemp seed)
- Pasta (with 12% hemp flour)
- Chocolate (with 12% hemp seed)
- Chocolate cookies (with 7.5% hemp flour and 7.5% hemp seed)
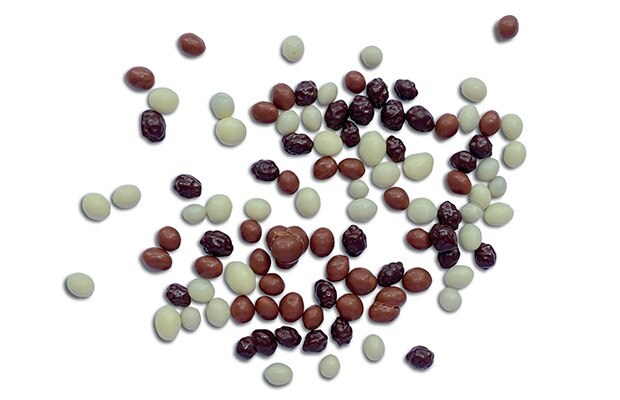
- Chocolate covered hemp seed (with 25% hemp seed)
Sample preparation
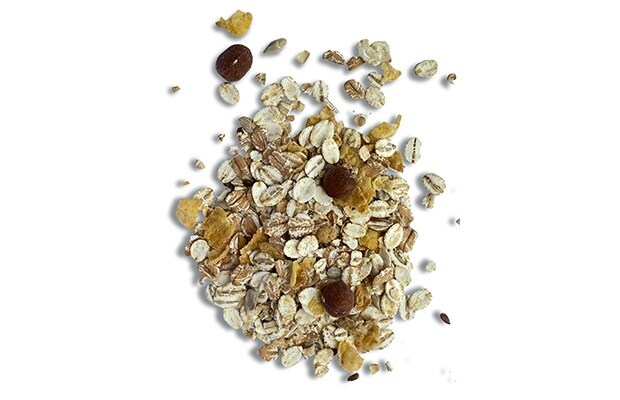
Homogenize approximately 2.5 g of each food sample using a mortar and pestle. Applying this process results in the generation of a coarse powder comparable to ground coffee beans (see Figure 1). Chocolate containing samples are recommended to be frozen at -20 °C prior to grinding in order to improve homogenization effect.
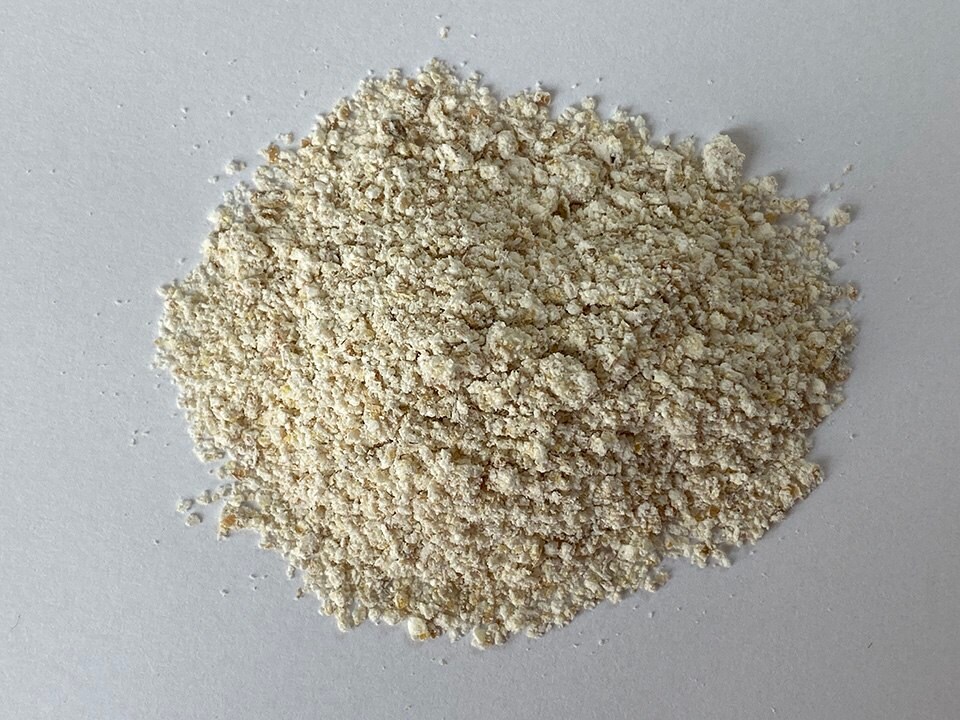
Figure 1.Cereals after grinding with mortar and pestle.
Materials and Methods
Preparation of internal standard, blank and food sample solutions
- General: Weigh samples on a calibrated analytical balance with a readability of 0.1 mg. Use single-channel pipettes with variable volume and gravimetrically tested polypropylene pipette tips for reagent, standard and sample transfers.
- Indium standard solution (internal standard): Pipette 3 mL nitric acid 60% and 1000 µL of indium ICP standard (1000 mg/L) into a 100 mL volumetric quartz flask. Fill flask to mark with ultrapure water to obtain a final concentration of 10 µg/mL.
Note: Rhodium ICP standards may also be used as alternative internal standards. - Blank solution: Pipette 3 mL nitric acid 60% and 1 mL hydrogen peroxide 30% into a 15 mL quartz microwave digestion vial and digest using a microwave digestion system (for conditions see section below). After completed digestion quantitatively transfer solution into a 50 mL polypropylene tube, combine with 50 µL of indium standard solution and fill to 50 mL with ultrapure water.
- Sample solution: Weigh 100 ±1 mg of ground food sample into a 15 mL microwave quartz vial. Add of 3 mL nitric acid 60% and 1 mL hydrogen peroxide 31% and digest sample utilizing a microwave digestion system. After completed digestion quantitatively transfer obtained solution into a 50 mL polypropylene tube, combine with 50 µL of indium standard solution and fill to 50 mL with ultrapure water.
Standard Addition Method of Calibration
To compensate for the sample matrix effects, a standard addition approach utilizing a certified reference material (CRM) Heavy Metal Mix IX standard solution and various ICP single element standards was applied for the preparation of all calibration curves. The final calibration curve was comprised of four data points (three standard addition solutions plus sample solution).
Preparation of calibration solutions for ICP-MS analysis
- Weigh 100 ±1 mg of ground sample into a 15 mL microwave quartz vial.
- Add 3 mL nitric acid 60%, 1 mL hydrogen peroxide 31% and different volumes of CRM Heavy Metal Mix IX standard solution and ICP single element standard solutions and digest sample using a microwave digestion system.
- After completed digestion, quantitatively transfer obtained solution into a 50 mL polypropylene tube, combine with 50 µL of indium standard solution and fill up to 50 mL with ultrapure water.
- Subject resulting sample to ICP-MS analysis.
Preparation of standard addition solutions
| Standard addition solution no. | Volume (Heavy Metal Mix IX)(µL) | Resulting concentration of As, Cd, Hg, Pb (initial sample weight 50 mg)(µg/g) |
|---|---|---|
| 1 | 100 | 1.000 |
| 2 | 200 | 2.000 |
| 3 | 500 | 5.000 |
| Standard addition solution no. | Volume (ICP single element standard)(µL) | Resulting concentration of Ag, Cr, Cu, Co, Ni, Sb and Se (initial sample weight 50 mg)(µg/g) |
|---|---|---|
| 1 | 50 | 5.000 |
| 2 | 100 | 10.000 |
| 3 | 200 | 20.000 |
| Standard addition solution no. | Volume (ICP single element standard)(µL) | Resulting concentration of Ba and Zn (initial sample weight 50 mg)(µg/g) |
|---|---|---|
| 1 | 50 | 50.000 |
| 2 | 100 | 100.000 |
| 3 | 200 | 200.000 |
| System | Microwave digestion system turboWAVE, MLS (Germany) (or equivalent) |
| Digestion program | Nitric acid digestion at 280 °C |
| Microwave vial | Quartz glass |
| Basic load | 110 mL ultrapure water and 5 mL nitric acid or 115 mL ultrapure water |
| Charging pressure | 40 bar |
| Deflation rate | 5 bar/min (from T < 80 °C) |
| Vessel cooling | Yes (> 40 °C) |
| Time (h) | Microwave output (W) | Temperature 1 (°C) | Temperature 2 (°C) | Pressure (bar) |
|---|---|---|---|---|
| 00:03:00 | 700 | 70 | 60 | 100 |
| 00:15:00 | 1000 | 180 | 60 | 120 |
| 00:30:00 | 1200 | 280 | 60 | 120 |
ICP-MS Conditions
| System | ICP-MS Element 2, ThermoScientific (or equivalent) |
| Plasma output | approx. 1300 W |
| Plasma gas flow | approx. 16 L/min |
| Sample delivery | Peristaltic pump (or equivalent), delivery volume approx. 1 mL/min |
| Nebulizer | Quartz spray chamber (or equivalent) / Meinhardt nebulizer (or equivalent) |
| Nebulizer gas flow | approx. 1 L/min |
| Assist gas flow | approx. 1 L/min |
| Mass resolution | 4000 + 10000 |
| Calibration | Standard addition |
The analysis was performed in the sequence: Blank, samples 1 – x, addition solutions.
Standard Addition Calibration Data
Standard addition solutions were prepared utilizing Heavy Metal Mix IX standard solution (As, Cd, Hg, Pb) and eight ICP single element standard solutions (Ag, Ba, Cr, Cu, Co, Ni, Sb, Se, Zn). Shown are the results obtained for the chocolate cookie sample. These revealed excellent linearity over the entire calibration range, with r2 values of > 0.9997 for all but arsenic (0.9922). The latter can be considered uncritical, as all analysis results are below 0.1 µg/g and corresponding recovery rates are excellent (see next chapter). Comparable results were achieved with all other hemp containing food samples. Shown in Figure 2 are the results obtained for the chocolate cookie sample.
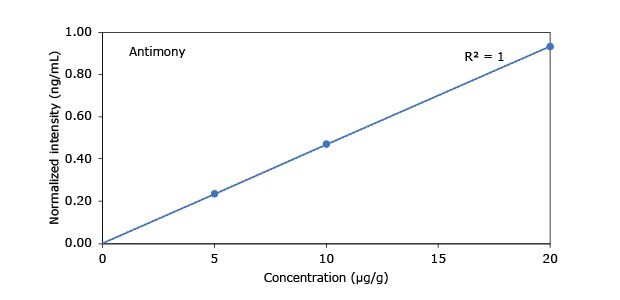
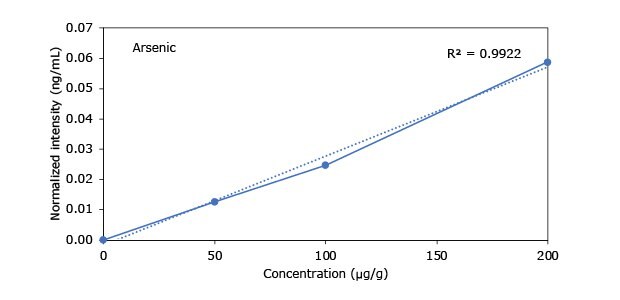
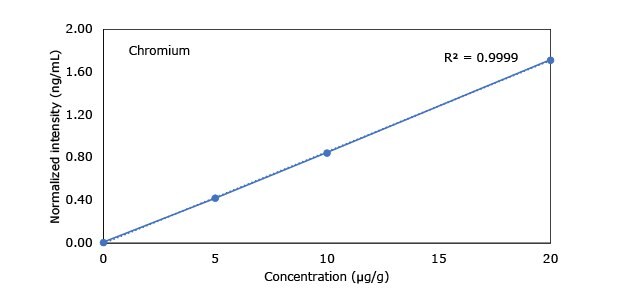
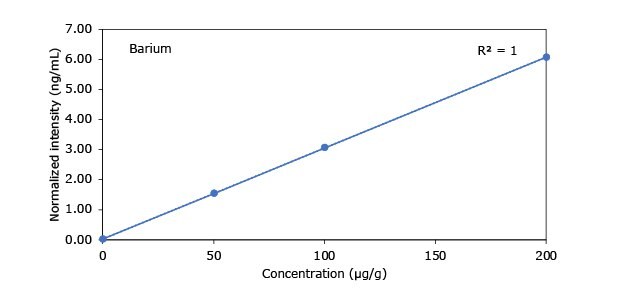
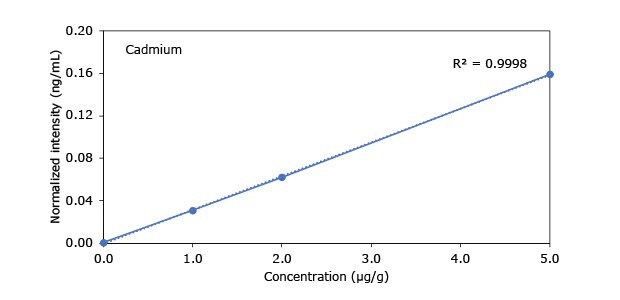
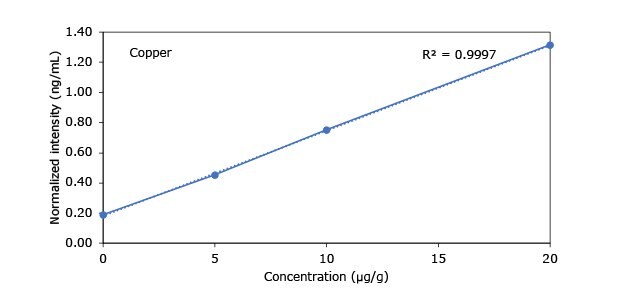
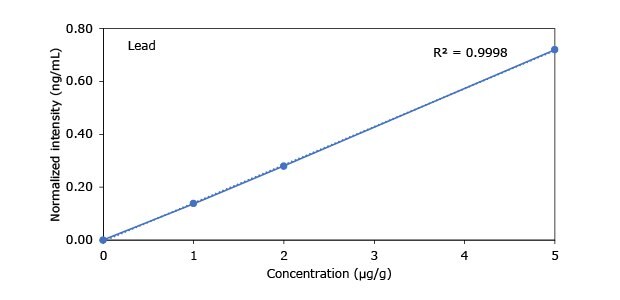
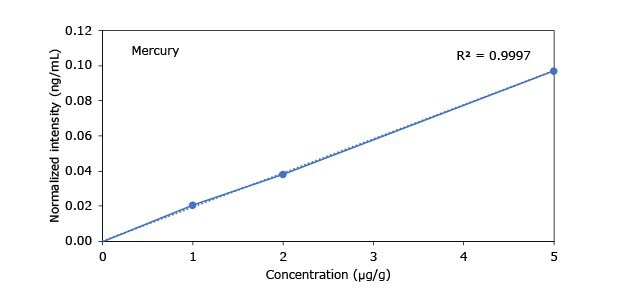
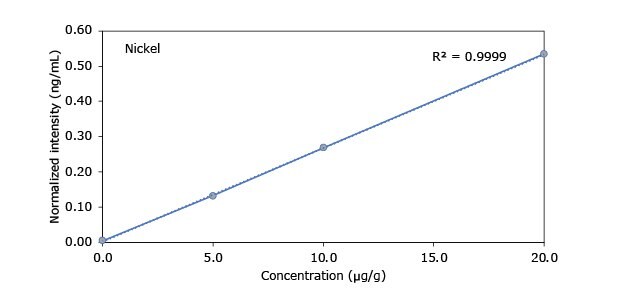
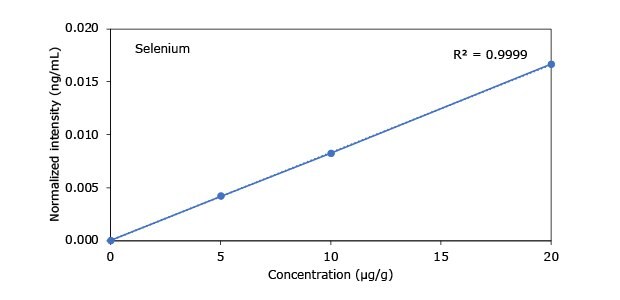
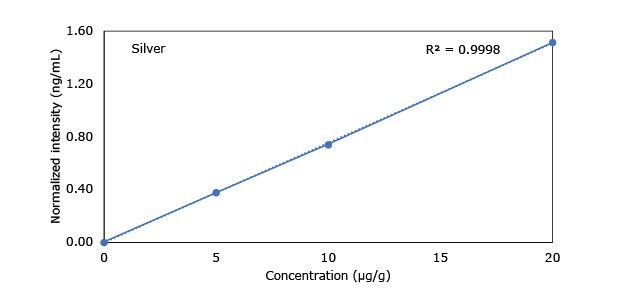
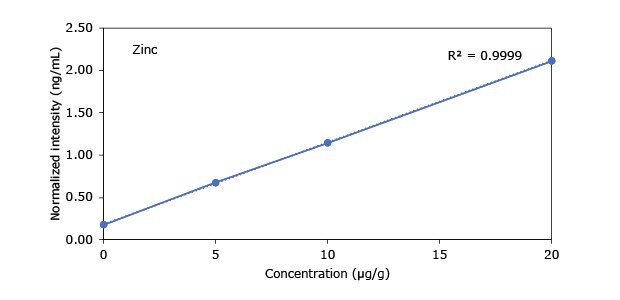
Figure 2.Graphical representation of method of standard addition for Ag, Ba, Cr, Cu, Co, Ni, Sb, Se, Zn metals in chocolate cookie samples.
Results
All hemp containing food samples were analyzed by ICP-MS as duplicates. The recovery rate (RR) for the samples was determined using Heavy Metal Mix IX standard solution and eight ICP single element standard solutions. RRs for all heavy metals were in the range of ±10% or better, except for mercury (±20%).
Cereals
Sample contains unknown amount of hemp seed.
| Element | # 1 [µg/g] | # 2 [µg/g] | RR [%] |
|---|---|---|---|
| Antimony | < 0.1 | < 0.1 | 95 |
| Arsenic | < 0.1 | < 0.1 | 97 |
| Barium | 0.5 | 0.5 | 100 |
| Cadmium | < 0.05 | < 0.05 | 95 |
| Chromium | < 0.1 | < 0.1 | 94 |
| Copper | 2.0 | 2.0 | 97 |
| Lead | < 0.1 | < 0.1 | 96 |
| Mercury | < 0.1 | < 0.1 | 80 |
| Nickel | 0.1 | 0.1 | 98 |
| Selenium | < 1 | < 1 | 97 |
| Silver | < 0.1 | < 0.1 | 98 |
| Zinc | 15 | 14 | 97 |
Pasta
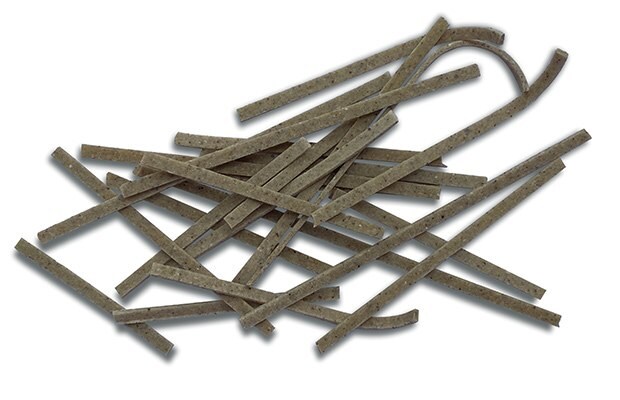
Sample contains 12% hemp flour.
| Element | # 1 [µg/g] | # 2 [µg/g] | RR [%] |
|---|---|---|---|
| Antimony | < 0.1 | < 0.1 | 98 |
| Arsenic | < 0.1 | < 0.1 | 95 |
| Barium | 1.1 | 1.0 | 99 |
| Cadmium | < 0.05 | < 0.05 | 92 |
| Chromium | 0.2 | 0.3 | 97 |
| Copper | 4.0 | 4.1 | 93 |
| Lead | < 0.1 | < 0.1 | 92 |
| Mercury | < 0.1 | < 0.1 | 87 |
| Nickel | 0.2 | 0.2 | 91 |
| Selenium | < 1 | < 1 | 97 |
| Silver | < 0.1 | < 0.1 | 94 |
| Zinc | 17 | 17 | 95 |
Chocolate
Sample contains 12% hemp seed.

| Element | # 1 [µg/g] | # 2 [µg/g] | RR [%] |
|---|---|---|---|
| Antimony | < 0.1 | < 0.1 | 97 |
| Arsenic | < 0.1 | < 0.1 | 101 |
| Barium | 3.4 | 2.9 | 98 |
| Cadmium | 0.1 | 0.1 | 103 |
| Chromium | 0.3 | 0.3 | 99 |
| Copper | 13 | 13 | 98 |
| Lead | < 0.1 | < 0.1 | 97 |
| Mercury | < 0.1 | < 0.1 | 109 |
| Nickel | 4.3 | 3.8 | 101 |
| Selenium | < 1 | < 1 | 100 |
| Silver | < 0.1 | < 0.1 | 100 |
| Zinc | 30 | 38 | 99 |
Chocolate cookies
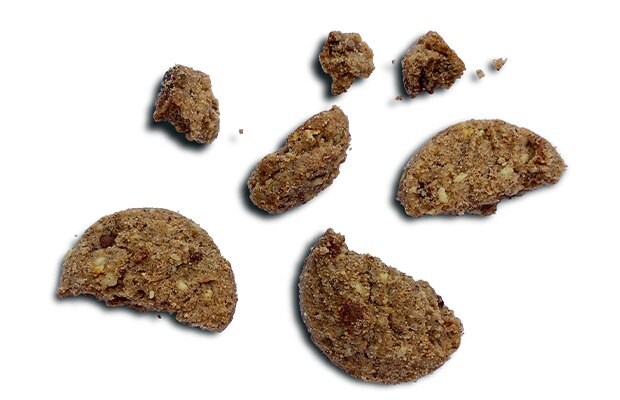
Sample contains 7.5% hemp flour and 7.5% hemp seed.
| Element | # 1 [µg/g] | # 2 [µg/g] | RR [%] |
|---|---|---|---|
| Antimony | < 0.1 | < 0.1 | 99 |
| Arsenic | < 0.1 | < 0.1 | 101 |
| Barium | 0.8 | 1.3 | 96 |
| Cadmium | < 0.05 | < 0.05 | 95 |
| Chromium | 0.1 | 0.1 | 99 |
| Copper | 3.3 | 4 | 93 |
| Lead | < 0.1 | < 0.1 | 95 |
| Mercury | < 0.1 | < 0.1 | 104 |
| Nickel | 0.2 | 0.4 | 98 |
| Selenium | < 1 | < 1 | 99 |
| Silver | < 0.1 | < 0.1 | 99 |
| Zinc | 18 | 23 | 103 |
Chocolate covered hemp seed
Sample contains 25% hemp seed.
| Element | # 1 [µg/g] | # 2 [µg/g] | RR [%] |
|---|---|---|---|
| Antimony | < 0.1 | < 0.1 | 100 |
| Arsenic | < 0.1 | < 0.1 | 101 |
| Barium | 1.9 | 1.8 | 102 |
| Cadmium | 0.07 | 0.07 | 104 |
| Chromium | 0.2 | 0.2 | 99 |
| Copper | 4.4 | 4.4 | 93 |
| Lead | < 0.1 | < 0.1 | 105 |
| Mercury | < 0.1 | < 0.1 | 115 |
| Nickel | 1.8 | 1.7 | 95 |
| Selenium | < 1 | < 1 | 103 |
| Silver | < 0.1 | < 0.1 | 94 |
| Zinc | 13 | 15 | 95 |
The content of antimony, arsenic, lead, mercury, selenium, and silver in all samples was below the limit of detection (Se: 1.0 µg/g, all others: 0.1 µg/g). Barium, copper, nickel, and zinc were detected in all samples, with concentrations ranging from 0.5 - 3.4 µg/g (Ba), 2.0 - 13 µg/g (Cu), 0.1 - 4.3 µg/g (Ni) and 13 - 38 µg/g (Zn), respectively. All samples but the cereals contained chromium (0.1 – 0.3 µg/g) and in both the chocolate and the chocolate covered hemp seed, cadmium was detected (0.07 – 1.0 µg/g).
Conclusion
This work demonstrates a comprehensive ICP-MS workflow, using the standard addition calibration method, for determination of heavy metals in hemp containing food products. Crucial elements in the process include homogenization of samples and use of an accurate traceable Certified Reference Material mix as well as ICP single element standard solutions. Samples were prepared by grinding with mortar and pestle. Samples were then digested utilizing a specific digestion protocol optimized to provide clear digestion solutions. The resulting solutions were subjected to ICP-MS analysis. Calibration data was obtained by the preparation and analysis of standard addition solutions obtained by utilizing one heavy metal CRM mix containing arsenic, cadmium, lead and mercury and a set of eight ICP single element standard solutions (Ag, Ba, Cr, Cu, Co, Ni, Sb, Se, Zn). The final results were consistent and revealed an Sb, As, Pb, Hg, Se and Ag content of all samples below the limit of detection. Barium, copper, nickel and zinc concentrations were ranging from 0.1 – 38 µg/g, the chromium content was found to be 0.1 – 0.3 µg/g (not detected in cereals) and the cadmium concentration was 0.07 – 1.0 µg/g (chocolate and chocolate covered hemp seed).
References
To continue reading please sign in or create an account.
Don't Have An Account?