Monitor Immunoassay Method Reproducibility with Belysa® Software
Belysa® software offers a user-friendly way to monitor immunoassay method reproducibility for ELISA readers, as well as Luminex® and SMCxPRO® instruments. Immunoassay users are often well aware of the potential for variability to influence the outcome of their experiments. At the individual plate level, between assays, and between lots of assays, there are numerous considerations when evaluating the method that is being applied to a study. An excellent paper by Khan et al. (2015) described the challenges that RUO (Research Use Only) assay users may face, and suggested strategies that can be used to evaluate them1. Belysa® software was designed to help immunoassay users address several key points raised in this, and other, papers.
A key challenge for many scientists is the ability to see variability within their method. An individual plate may be easy to evaluate for replicate coefficient of variation percentage (%CV) or parameters such as the expected recovery of the assay. However, as the number of assays performed increases, or even as the volume of data increases with multiplex experiments, it can become repetitive and laborious to perform the appropriate checks. As projects extend to the point where multiple lots of the same kit are required, it is important to be aware of any lot-to-lot differences, which is normally done by comparing standard curves. To this end, we have designed the Belysa® Immunoassay Curve Fitting Software, a tool that allows you to easily monitor your method and ensure it is reproducible over time.
Read on to see how this software can be used:
- At the single assay level
- Over multiple plates
- Over multiple lots
What Is Belysa® Immunoassay Curve Fitting Software?
Belysa® Immunoassay Curve Fitting Software is a user-friendly tool that allows you to evaluate your assay data and compare standard curves. With Belysa® software, bench researchers gain the ability to easily and affordably evaluate method reproducibility and consistency between immunoassays plate to plate and over the course of longitudinal studies. This software allows the user to check and flag technical parameters before comparing curves between runs to ensure the method was consistent over the course of a study.
Discover how to gain more insights into your immunoassay methods in the Belysa® Application Note.
Evaluating a Single Plate
The Belysa® software allows the user to quickly evaluate a single plate of an immunoassay in a number of ways. First, the software shows the distribution of the samples against the standard curve and plot the lower limit of quantitation (LLOQ) (Figure 1). This will be done for all biomarkers within an acquisition file. From this, we can immediately tell that the assay had a suitable dynamic range for the samples tested. Further, the screen contains an optimization wizard which will select the optimal curve to fit the standard points as provided metrics, such as the curve equation and limit of detection (LOD) of the assay.
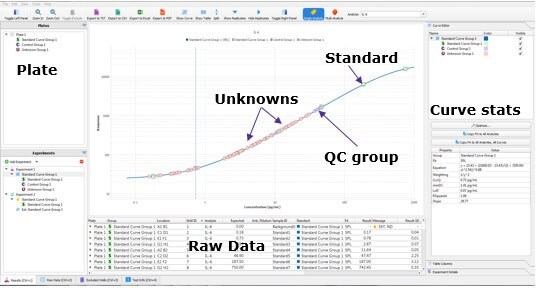
Figure 1.Belysa® Immunoassay Curve Fitting Software demonstrating the samples distributed on the standard curve and the position of the LLOQ (QC = quality control).
The user can then move to the “raw data” tab. Within this data; are the details such as the variance between sample replicates or the expected recovery of the standard curve points. In the software, the user can set the Replicate %CV or % Recovery they accept, and flags will be applied against any data point that is outside the criteria (Figure 2). By using this tool, a scientist can quickly ensure that the standard curve and samples performed in a fashion that can be reproduced by another scientist.
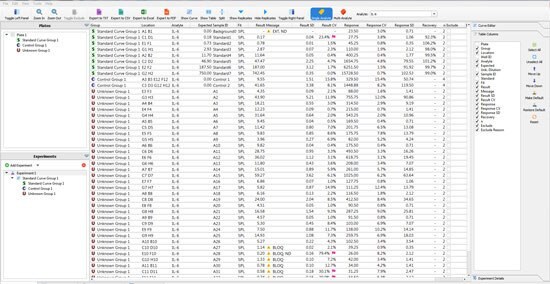
Figure 2.The raw data generated by a single 96-well immunoassay. The Belysa® tool assigns flags according to the lab’s specifications.
Over Multiple Plates From a Single Lot
The multi-plate experiment from a single lot is a strategy used for both fresh and archived samples where kits from a single batch have been purchased. The advantage of this approach is that there will be no variability from the assay lot, however, the lab may experience inter-assay variance simply by having multiple users conduct the assays. Differences in technique, such as pipetting or reagent preparation, can affect the Optical Density (OD) of the standard curve.
It is important to compare the standard curves of each assay to ensure that the slopes of each plate’s standard curves are similar. If the slopes are similar, the samples should also report similarly. The Belysa® software contains a mathematical parallelism tool that allows for the importation of standard curves. Each curve will have a slope ratio calculated against the first curve added to the tool. A ratio of 1 indicates a set of perfectly parallel curves (Figure 3), although often it is not hard to spot a deviation by eye (Figure 4).
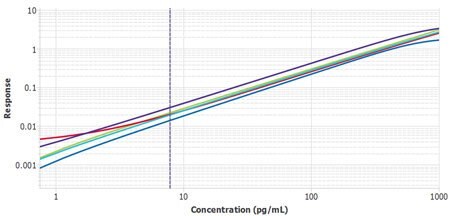
Figure 3.Six plates of monocyte chemoattractant protein-1 (MCP-1) ELISA from three lots, run by two separate operators, with Plate 1 from Lot 1 used as the reference curve. A slope ratio of 1 indicates that the linear portions of the curve are mathematically parallel.
The process to import the tool is extremely simple. Within minutes, a scientist can import all their curves and quickly determine that they or their team have faithfully executed their protocol multiple times.
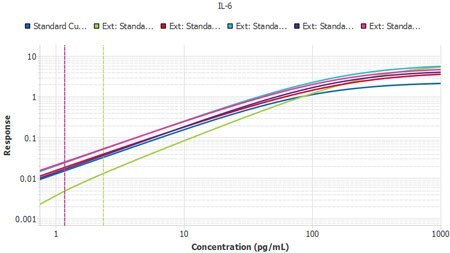
Figure 4.Six plates of interleukin-6 (IL-6) ELISA from three lots, run by two separate operators, with Plate 1 from Lot 1 used as the reference curve. A slope ratio of 1 indicates that the linear portions of the curve are mathematically parallel. P2 was identified as a user deviation, later confirmed by the user.
Over Multiple Lots
Perhaps the most frustrating and expensive source of variation is that between different lots of assays. Once a study enters its second year, the laboratory will likely need to purchase kits that are constructed from different lots of components. At this stage, a method is required to confirm the kits are performing similarly. One preferred strategy is to perform a sample bridge between the new lot and the prior lot to ensure the samples report similarly. The Belysa® Parallelism Tool can aid and enhance this kind of work over a longitudinal study. As each new lot of kits arrives, the curves can be imported from previous batches so the slope ratios can be compared against a reference curve from the original batch to ensure consistent lot performance (Figure 5).
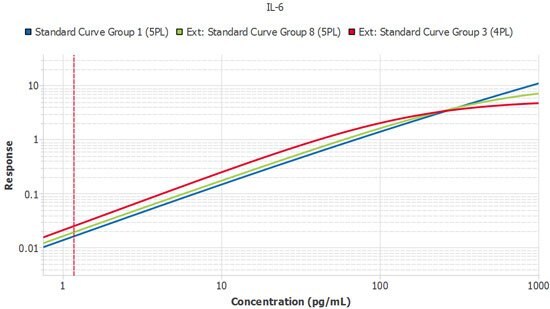
Figure 5.A single plate from three lots of IL-6 ELISA run by the same scientist. Slope ratios were within the acceptance criteria of 1 +/- 0.1.
Summary of Monitoring Method Reproducibility
The Belysa® software is a tool designed by our software and immunoassay experts. Each of the applications was proposed to enhance the capability of immunoassay users to evaluate their method for consistency of application, starting with that of a single plate and working up to the evaluation of multiple kit lots over years of study. With an extremely user-friendly interface, these checks become rapid and easy to apply, ensuring that any method deviations are caught early and therefore may potentially be ameliorated.
Discover more information about this software and schedule a demonstration by filling out our online contact form on our Belysa® Landing Page.
References
Highlighted Belysa® Publications
- Carlson KN, Pavan‐Guimaraes J, Verhagen JC, Chlebeck P, Verhoven B, Jennings H, Najmabadi F, Liu Y, Burlingham W, Capitini CM, et al. 2021. IL‐10 and TGF‐β cytokines decrease immune activation during normothermic ex vivo machine perfusion of the rat liver. Liver Transplantation. https://doi.org/10.1002/lt.26206.
- Bender DE, Schaettler MO, Sheehan KC, Johanns TM, Dunn GP. 2021. Cytokine Profiling in Plasma from Patients with Brain Tumors Versus Healthy Individuals using 2 Different Multiplex Immunoassay Platforms. Biomarker Insights. https://doi.org/10.1177/11772719211006666.
- Abreu D, Stone SI, Pearson TS, Bucelli RC, Simpson AN, Hurst S, Brown CM, Kries K, Onwumere C, Gu H, et al. 2021. A phase 1b/2a clinical trial of dantrolene sodium in patients with Wolfram syndrome. JCI Insight. https://doi.org/10.1172/jci.insight.145188.
- Scheinman SB, Zaldua S, Dada A, Krochmaliuk K, Dye K, Marottoli FM, Thatcher GRJ, Tai LM. 2021. Systemic candesartan treatment modulates behavior, synaptic protein levels, and neuroinflammation in female mice that express human APOE4. Frontiers in Neuroscience. 15. https://doi.org/10.3389/fnins.2021.628403.
- Steinbach S, Jalili-Firoozinezhad S, Srinivasan S, Melo MB, Middleton S, Konold T, Coad M, Hammond PT, Irvine DJ, Vordermeier M, et al. 2021. Temporal dynamics of intradermal cytokine response to tuberculin in Mycobacterium bovis BCG-vaccinated cattle using sampling microneedles. Scientific Reports. 11(1). https://doi.org/10.1038/s41598-021-86398-6.
- Zarkoob H, Allué-Guardia A, Chen Y-C, Jung O, Garcia-Vilanova A, Song MJ, Park J-G, Oladunni F, Miller J, Tung Y-T, et al. 2021. Modeling SARS-CoV-2 and influenza infections and antiviral treatments in human lung epithelial tissue equivalents. https://doi.org/10.1101/2021.05.11.443693.
- Oladunni FS, Park J-G, Pino PA, Gonzalez O, Akhter A, Allué-Guardia A, Olmo-Fontánez A, Gautam S, Garcia-Vilanova A, Ye C, et al. 2020. Lethality of SARS-CoV-2 infection in K18 human angiotensin-converting enzyme 2 transgenic mice. Nature Communications. 11(1). https://doi.org/10.1038/s41467-020-19891-7.
Did you use Belysa® software in your research?
How to cite Belysa® Immunoassay Curve Fitting Software in your publication:
- If you are based in the United States or Canada, state MilliporeSigma as the source of your assay.
- If you are based anywhere in the world outside of the United States or Canada, state Merck KGaA, Darmstadt, Germany, as the source of your assay.
- Include your use of Belysa® Immunoassay Curve Fitting Software and the catalog number (Cat. No. 40-122).
- If you used our SMC® ultrasensitive assays, Conferma™ ELISAs, or MILLIPLEX® multiplex immunoassays, include the full kit name and catalog number. For MILLIPLEX® kits, also list the analytes you used from the kit.
- Be sure to include the species of samples you used and how you diluted your samples.
- Be sure to include the species of samples you used and how you diluted your samples.
계속 읽으시려면 로그인하거나 계정을 생성하세요.
계정이 없으십니까?