Enzyme Inhibitor Terms and Calculations
Read on to learn useful enzyme inhibitor terms and calculations, understand Michaelis-Menten kinetics including how to determine Km and Vmax, and how to accurately compare enzymes through catalytic efficiency.
- Useful Terms in Enzyme Inhibitor Research
- Michaelis-Menten Kinetics: Significance of Km and Vmax
- How to Determine Km and Vmax
- Calculating Catalytic Efficiency to Compare Enzymes
Useful Terms in Enzyme Inhibitor Research
Some specific terms are useful to understand when researching with enzyme inhibitors. Below are some definitions of common terms used when analyzing data.
Km
Km is the substrate concentration at which half the maximum velocity of the reaction is observed under a given set of conditions (Figure 1). It is an inverse measure of the binding strength between the substrate and the enzyme where lower Km means a higher affinity and a lower concentration of substrate is required to achieve maximum reaction rate. Km values are dependent upon pH, temperature, and other reaction conditions.
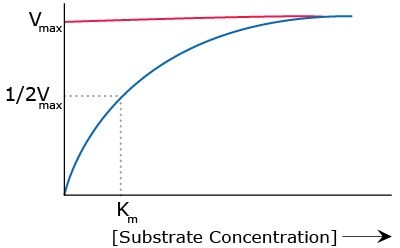
Figure 1.Relationship between substrate concentration and maximum velocity of reaction.
Vmax
Vmax is the maximum velocity of a reaction under given conditions (Figure 1). Vmax is reached when all enzyme sites are saturated with the substrate. This will happen when the substrate concentration [S] is greater than Km so that [S]/([S]+Km) approaches 1.
EC50
EC50 determines the clinical efficacy of a drug and is reported as the drug concentration required to produce 50% of the maximum effect (may be an inhibitory or a stimulatory effect). The inhibitory response is halfway between the baseline and maximum after exposure to an inhibitory molecule for a selected period of time. This term is used usually with pharmaceuticals.
IC50
IC50 is the concentration required to produce 50% inhibition (Figure 2). The amount of inhibitor required depends on various factors, such as the substrate concentration, target accessibility, cell permeability, duration of incubation, type of cells used, and more. Something to watch out for is that a lower IC50 generally means a more potent inhibitor, which also could mean higher toxicity at lower doses.
It is best to search the literature to determine the initial concentration.
- If published Ki or IC50 values are known, use 5 to 10 times higher than these values to maximally inhibit the enzyme activity.
- If Ki or IC50 values are unknown, then one should try a wide range of inhibitor concentrations and use Michaelis-Menten kinetics (see more on this below) to determine the Ki value.
It is not unusual to see either no inhibition or even a reverse effect when high concentrations of inhibitors are used.

Figure 2.Relationship between inhibitor concentration and IC50.
Ki
Ki is the inhibitor concentration at which 50% inhibition is observed (Ki = enzyme inhibition constant). Cheng and Prusoff developed an equation in 1973 that simplifies the calculation of Ki when IC50 is known. 1
Ki can be calculated from the IC50 using the equation:
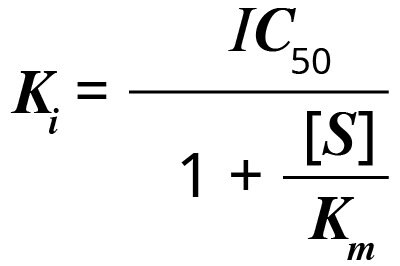
where [S] is the concentration of substrate, and Km is the substrate concentration (in the absence of inhibitor) at which the velocity of the reaction is half-maximal. The Ki of an inhibitor for inhibition of a particular substrate (a fixed Km) is constant. For a different substrate, Km is different, and so is the Ki.
Key Points:
- IC50 is the functional strength of the inhibitor and is not an indicator of its affinity.
- IC50 value for a compound may vary between experiments, depending on experimental conditions.
- Ki reflects the binding affinity of the inhibitor. It is an absolute value.
ED50
ED50 is the median effective dose (as opposed to concentration) at which 50% of individuals exhibit the specified quantal effect. It is a measure of reasonable expectance of a drug effect, but not necessarily equal to the prescribed dose.
Michaelis-Menten Kinetics: Significance of Km and Vmax
Understanding Michaelis-Menten kinetics is critical to working with enzyme inhibitors.
Km Kinetics
The Michaelis-Menten constant, Km, defined as the substrate concentration at which half maximum velocity is observed, varies considerably from enzyme to enzyme. It also varies with different substrates for the same enzyme. When the substrate concentration is equal to the Km value, half of the enzyme’s active sites are occupied by substrate molecules.
Key Points About Km:
- Km is a constant with units M
- Km is a constant derived from rate constants
- Km is, under true Michaelis-Menten conditions, an estimate of the dissociation constant of enzyme and substrate
- A small Km means tight binding; a high Km means weak binding
In the Michaelis-Menten model for enzyme kinetics, it is assumed that the enzyme first reacts with the substrate to form an enzyme-substrate complex (ES) that breaks down to form product (P) and free enzyme (E). Hence, Km can be expressed in terms of three rate constants (k1, k-1, and k2).
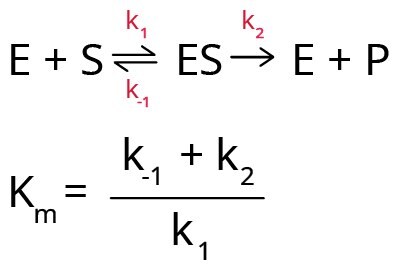
Km also depends on temperature, nature of substrate, pH of the reaction medium, ionic strength, and any other reaction condition. Hence, it is important to characterize enzyme-substrate reactions under specifically defined conditions. Any variation in the Km value indicates the presence of either an activator or an inhibitor in the reaction medium.
At very low substrate concentrations, the initial velocity of the reaction is proportional to the substrate concentration [S] and the reaction is of first order with respect to the substrate. As [S] is increased, the initial rate of reaction declines and is not proportional to [S]. Under these conditions, the reaction is of mixed order. And, with further increase in [S], the reaction rate becomes independent of [S] and it asymptotically approaches a constant rate. At this point, the reaction is of zero order and the enzyme is considered to be saturated with substrate. The time course of the formation of enzyme-substrate complex and product can be represented as shown in Figure 3.
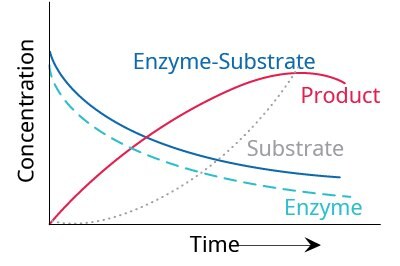
Figure 3.Temporal dependence of relative concentrations of enzyme reaction components.
Vmax Kinetics
Vmax, the maximum rate of reaction, is the rate at which the total enzyme concentration is present as the enzyme-substrate complex. Vmax represents the maximum achievable rate of reaction under given conditions.
Key Points About Vmax:
- Vmax is a constant with units s-1
- Vmax is the theoretical maximal rate of the reaction; in reality, it is never achieved
- Reaching Vmax requires that all enzyme molecules are bound to substrate
- Vmax is asymptotically approached as [S] is increased
If the initial enzyme concentration is known, then the value of k2 can be determined from Vmax. Since k2 is a first order rate constant, it is expressed per unit time (per minute or second). It is also known as the turnover number or the catalytic constant, kcat. The turnover number is the number of substrate molecules that can be converted to product in a given period of time under conditions where the enzyme is completely saturated with substrate.
It is easy to estimate the turnover number by measuring the reaction rate under saturating substrate conditions (where [S] is greater than Km). Generally, under physiological conditions, [S]/Km is less than 1. If [S] is greater than Km, then the initial velocity (V0) of the reaction can be written as follows:
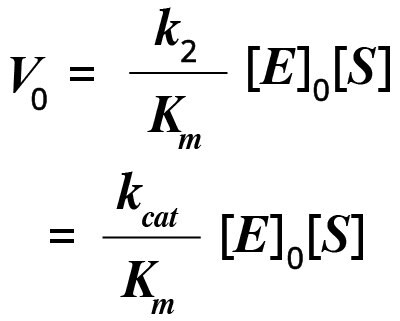
In this equation, kcat/Km is a measure of catalytic efficiency, with a larger value corresponding to the formation of more product.
Irreversible and Allosteric Inhibition
Michaelis–Menten kinetics cannot be applied for irreversible inhibition because the inhibitor forms a strong covalent bond with the enzyme and cannot be removed. Hence, the effectiveness of the irreversible inhibitor is determined by the rate at which this binding takes place. A very common example of irreversible inhibition is the diisopropylfluorophosphate (DFP) reaction with acetylcholinesterase (AChE). DFP forms a covalent bond with the hydroxyl group of the serine residue at the active site of AChE. The complex formed is so stable that normal nerve function is restored only after a new enzyme is synthesized.
Allosterically regulated enzymes also do not fit into Michaelis-Menten equations. Here, instead of a hyperbolic reaction curve, a sigmoidal curve is obtained. These enzymes possess multiple binding sites and their activity is regulated by the binding of inhibitors or activators.
How to Determine Km and Vmax
Km and Vmax can be determined experimentally by incubating the enzyme with different concentrations of substrate. The results can be plotted as a graph of velocity or rate of reaction (V) against the concentration of substrate [S]. This will produce a hyperbolic curve. The reaction velocity and Km have the following relationship.
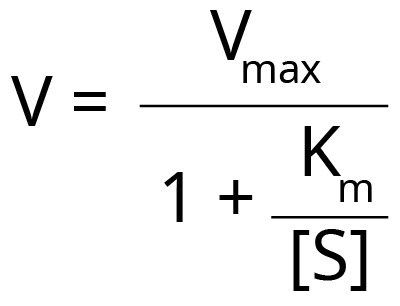
Even under expert hands, it is difficult to fit the best hyperbola through all the experimental points to determine Vmax accurately. Scientists have developed methods to rearrange the Michaelis-Menten equation to allow more precise fitting to the experimental points and estimate Vmax and Km. However, with each method, there are some advantages and disadvantages.
Lineweaver-Burk Plot
The Lineweaver-Burk double reciprocal plot (Figure 4) is one of the most common methods that rearranges the Michaelis-Menten equation as follows:

When we plot 1/V against 1/[S], a straight line is obtained where the:
- Y-intercept = 1/Vmax
- Gradient/Slope = Km/Vmax
- X-intercept = -1/Km
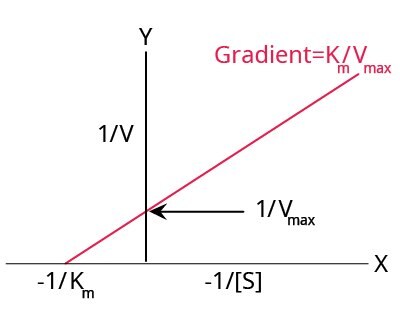
Figure 4.A typical Lineweaver-Burk plot.
Lineweaver-Burk plots are the most widely used plots for linearizing the data and they give the most precise estimates of Km and Vmax. However, this method places undue weight on the points obtained at lower substrate concentrations, i.e., the highest values of 1/[S] and 1/(V).
Eadie-Hofstee Plot
Another method for graphically representing enzyme kinetics is the Eadie-Hofstee plot (Figure 5), where the reaction rate is plotted as a function of the ratio between reaction rate and substrate concentration.
This plot rearranges the Michaelis-Menten equation as follows:
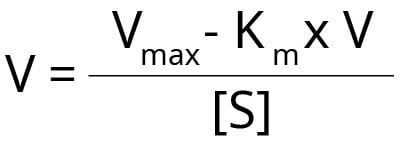
When we plot reaction rate V against V/[S] it gives a straight line where the:
- Y-intercept = Vmax
- Gradient/Slope = –Km
- X-intercept = Vmax/ Km
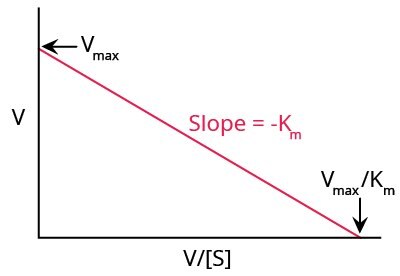
Figure 5.A typical Eadie-Hofstee plot.
Unlike the Lineweaver-Burk plot, this method gives equal weight to all data points in any range of substrate concentration. A disadvantage of this method is that neither X nor Y axes represent independent variables, and both are dependent on reaction rate. Any experimental or instrument error will affect both axes to a larger extent.
Calculating Catalytic Efficiency to Compare Enzymes
When we compare the rates of reactions of different enzymes acting on a substrate or the same enzyme acting on different substrates, calculating relative catalytic efficiencies can inform us which enzyme is best suited to which substrate(s) under a given set of conditions.
If an enzyme is acting under steady-state conditions, then the kinetic parameters of that enzyme to consider are kcat (the catalytic constant for the conversion of substrate to product) and Km (the Michaelis-Menten constant). Here kcat is the turnover number, which indicates how much substrate is converted to product in a specific period of time. The ratio of kcat/Km is equal to the catalytic efficiency, which is then used to compare enzymes. This measure of efficiency helps determine whether the rate is limited by the creation of product or the amount of substrate in the reaction mixture. Generally, the upper limit of kcat/Km is determined by the rate of diffusion of the substrate to the active site of the enzyme.
Under certain conditions, an enzyme may act on two somewhat related substrates. Here, one has to consider the relative rates of reaction with each substrate, because each substrate has its own Km value. However, if Km is the sole determinant of enzyme specificity, then, as the ratio [S]/Km increases above 1, kcat becomes the best parameter to determine which substrate is better. With two substrates (x and y) being acted upon by the same enzyme, simultaneously, the following equation can be created for the relative velocities of reactions.
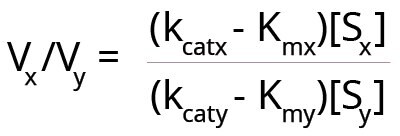
Here Vx and Vy are the velocities of the enzyme reaction with substrates x and y. Substrate concentrations of the two substrates are [Sx] and [Sy].
Finding the right equations to suit your research is essential to experimental success. Get started on your next experiment today by searching our Bioactive Small Molecule search tool to find high-quality probes for your research.
References
To continue reading please sign in or create an account.
Don't Have An Account?