Reversed-Phase HPLC Analysis of Insulin Variants and Analogs by UV and Mass Spectral Detection
Cory Muraco, Stacy Shollenberger, Hillel Brandes
MilliporeSigma, Bellefonte, PA USA
Background
Insulin is an approximately 6000 Da peptide hormone used to regulate the glucose concentration in blood. There are several different forms of insulin that are both natural and recombinant; the recombinant forms have been engineered to improve pharmacokinetic properties.1 A quick and reliable chromatographic technique was developed to identify and detect a mixture of insulin variants in an unknown sample. This is of utmost importance to pharmaceutical quality control (QC) labs as some formulations of insulin-containing drugs needs to include only a single, correct form of insulin for the drug to elicit its biotherapeutic effects or not to elicit an allergic response from the patient.2
Experimental Methods
A mixture of six insulin variants (insulin-bovine, insulin-human, insulin-porcine, insulin-lispro, insulin-Asp, and insulin-glargine, 100 µg/mL, 0.1% aqueous trifluoroacetic acid) was analyzed chromatographically on a BIOshell™ A160 Peptide C18 HPLC column using a Thermo Ultimate™ BioRS 3000 UHPLC (UV detection) and an Agilent® 1290/6530 Q-TOF system (mass spectral detection). All analyses were performed in triplicate and the elution order of the insulin variants was confirmed by mass spectral analysis.
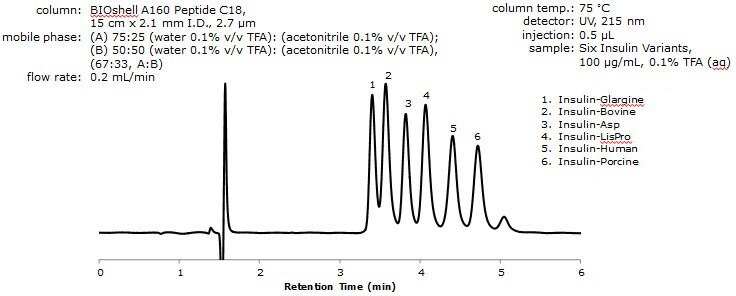
Figure 1. Separation of Insulin Variants by RPC
- Resolution between the critical pair of analytes (i.e. peaks 1 and 2) was determined to be 1.09 with resolutions between all other analytes being between 1.09 and 1.70.
- Considering the structural similarity between the different insulin variants (as an example, Insulin-LisPro and Insulin-Human are isobars), this resolution was deemed acceptable.
- In order to try and improve resolution of the insulin variants, a series of experiments were conducted that looked at changes in flow rate and how that affected the resultant chromatography of the insulin variants.
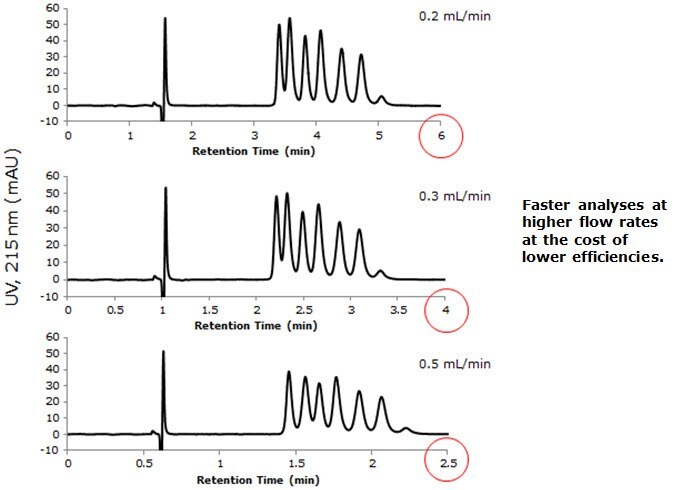
Figure 2. Resolution of Insulin Variants: Effect of Flow Rate
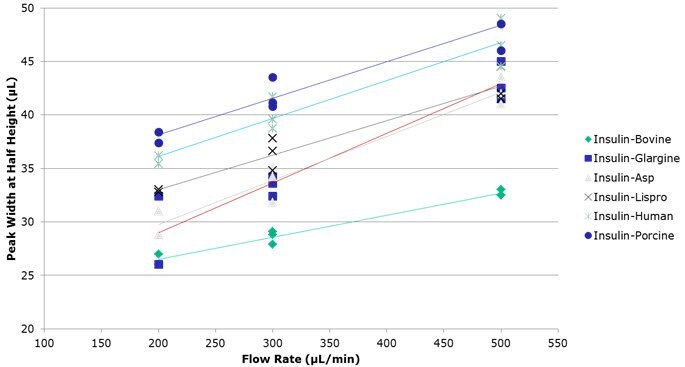
Figure 3.Peak Width, Half Height Versus Flow Rate for the Six Insulin Variants
- Although the method described obtains good resolution of the insulin variants, the method relies on UV detection.
- There is a growing demand in the biotherapeutics field for chromatographic methods that incorporate mass spectrometry.
- The previous method uses trifluoroacetic acid as an ion pair reagent; however, this additive interferes with efficient nebulization and ion-pairs with analyte in the gas phase, thus greatly reducing the concentration of available analyte ions.
- Therefore, an MS-compatible method was developed incorporating an alternative ion pairing reagent in the mobile phase.
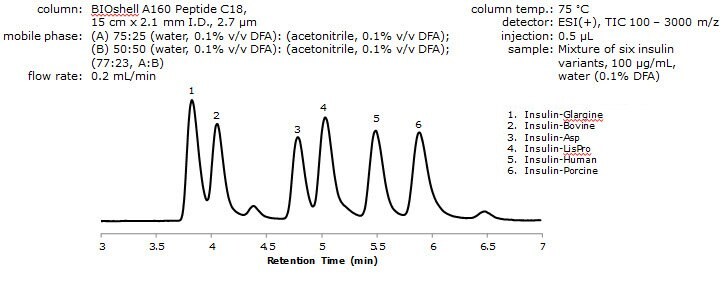
Figure 4. Analysis of Insulin Variants by LC/MS using DFA
- Resolution between the critical pair of analytes (peaks 1 and 2) was determined to be 1.05 with resolutions between all other peaks being between 1.05 and 1.65.
- DFA, having less of an effect on ion suppression than TFA, while still being volatile, minimizes secondary interactions due to charge-charge repulsions, thus resulting in minimal peak broadening and tailing.3
- Due to the fact that some signal suppression still occurs with using DFA as an additive in the mobile phase, a third solvent system was employed, using an 8 mM ammonium formate solution, pH adjusted to 2.6.

Figure 5. Analysis of Insulin Variants by LC/MS Using 8 mM Ammonium Formate, pH 2.6
*Determined by deconvolution of raw, mass spectral profile data.
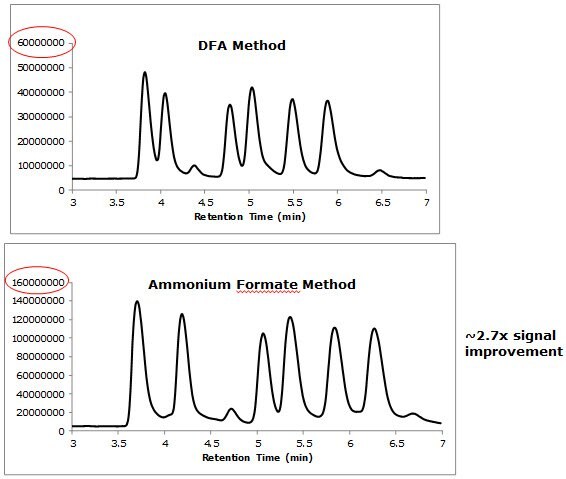
Figure 6. Comparison of Signal Intensities Between Two LC/MS Methods
Conclusions
- Three methods were developed that allows for the resolution and quantitation of a mixture of six insulin variants.
- The UV-based method, which employs TFA as an ion pair agent, yielded peaks with high efficiencies.
– Different flow rates were examined where it was found that higher flow rates yielded faster run times, still resolving the
insulin variants, albeit at the cost of efficiency. - The MS methods, which used either DFA or ammonium formate, allowed for approximately baseline resolution of all the insulin variants without the signal suppression that would have resulted from the use of TFA.
– 0.1% (v/v) formic acid was also tried during this study (data not shown), but this additive resulted in extensive tailing and
poor resolution of the insulin variants.
– 0.1% (v/v) TFA actually resulted in negative peaks in the TIC (data not shown).
– This is due to the TFA ions suppressing the ionization of the insulin analyte ions and only a loss in the baseline intensity
of ionized TFA is observed.
Future Work
- Further optimization of the separation methods.
- Analysis of additional insulin variants/analogs by LC/MS.
Materials
References
BIOshell is a trademark of Sigma-Aldrich Co. LLC.
Agilent is a registered trademark of Agilent Technologies, Inc.
Thermo Ultimate is a trademark of Thermo Fisher Scientific Inc.
To continue reading please sign in or create an account.
Don't Have An Account?