Single Molecule Detection with Atto 647N NTA
Ruud Hovius, Emmanuel Guignet, Jean-Manuel Segura, Joachim Piguet, Horst Vogel
Significant improvement of single molecule tracking by using superior fluorescent NTA-Atto 647N conjugate
Ruud Hovius, Emmanuel Guignet, Jean-Manuel Segura, Joachim Piguet & Horst Vogel (Institute de Science Biomoleculaire, EPFL, Switzerland), Monika Bäumle (MilliporeSigma)
- Atto 647N is a superior fluorescent dye for single molecule tracking experiments
- Excellent photostability of the label enables the acquisition of a significant increase in information content
General advantages of fluorescent NTA conjugates
Fluorescent NTA conjugates have been used to detect oligohistidine tagged proteins on blots, in gels, or in solution (Figure 1). Recently, this approach has been extended to the detection and characterization of proteins in living cells (Guignet 2004).
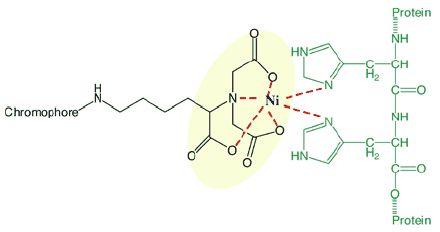
Figure 1.Interaction of a Ni-NTA-chromophore with an oligohistidine tagged protein.
Major advantages of this labeling method are:
- the flexibility to use the fluorophore best suited for the application - the nature of the fluorophore has little affect on the binding characteristics of the NTA-probe to the His-tag. The dissociation constants observed for the binding to hexa and decahistidine tagged green fluorescent protein in solution are in the range of 5 to 0.5 μM.
- very fast kinetics - labeling in cells was demonstrated to be complete within 30 seconds and fully reversible within a few minutes upon addition of a strong chelator.
- the reversibility of the interaction allows recovery of the sample.
Single molecule imaging – Atto 647N has excellent photostability
The detection of oligohistidine tagged proteins often involves large populations of target molecules; however, another important application of the NTA-labeling method is the imaging of a single fluorescently labeled molecule in live cells. In single molecule imaging the fluorescent labels are exposed to strong irradiation. Under these conditions most common labels undergo relatively rapid photodestruction, limiting the number of images that can be gathered. Usually, 10-25 images can be acquired with wide-field illumination before bleaching occurs, resulting in short traces of the target molecule’s displacement. This in turn has a strong impact on the information that can be extracted. For instance, the mean square displacement analysis of a molecule of which n images have been recorded will contain [1+ ...+ (n-1)] data points. For example, one trace composed of 30 images will give ten times more data points than a trace of 10 images.
Atto 647N has great potential for single molecule studies due to its great photostability and brightness. In a comparative experiment, the ionotropic serotonin receptor expressed in mammalian cells was labeled with either a Cy™5 or an Atto 647N probe. Single molecule imaging revealed the Atto 647N was more photostable than Cy5, having a 2-fold lower bleaching rate (Figure 2). The Atto 647N routinely allowed acquisition of films of 50 to 100 frames.
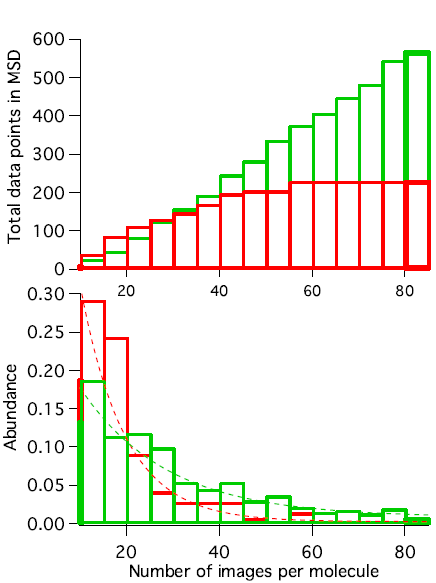
Figure 2.Atto 647N (green) is more photostable than Cy5 (red).
Top panel: The accumulative number of data points per molecule observed with Cy5 labeled molecules levels at approximately 200 for a maximal length of 55 frames. However Atto 647N delivers 3-fold more data points due to trace lengths up to 85 images.
Bottom panel: Trace length histogram for a Cy5 (red) and Atto 647N (green) labeled serotonin receptor probe shows that Cy5 undergoes photobleaching twice as fast as Atto 647N.
Atto 647N yields very long traces of diffusing single molecules
Films with long traces allow accurate description of the diffusional behaviour of an individual labeled molecule. Routinely for films with short traces, diffusional behaviour is evaluated by plotting the mean square displacement (MSD) observed in a series of relatively short films, each in the range of 12 frames, for a population of molecules versus time (Figure 3A). Depending on the type of diffusion a different dependence of the MSD on time is found.
The excellent properties of Atto 647N enable acquisition of image sequences up to approximately 100 frames (an example of 104 frames is shown in Figure 3B). Traces of this length allow the evaluation of the MSD of an individual particle, revealing details of its diffusional behaviour. If acquisition had been limited to 12 frames only, then one would have concluded that the diffusion of the particle was within a restricted area (confinement). Evaluation of the longer trace clearly indicates free Brownian diffusion (Figure 3C).
These observations are greatly facilitated by the application of very photostable and bright fluorophores like Atto 647N.
Evaluation of the diffusion of single molecule tracking
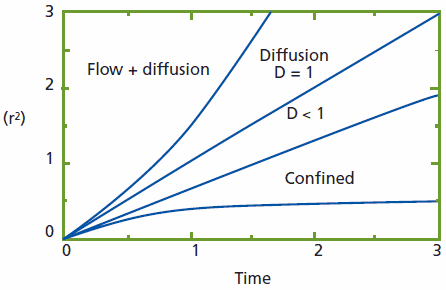
Figure 3a. Mean square displacement (MSD) of target molecules having different diffusion modes. Freely diffusing molecules feature an MSD (D=1) proportional with time: MSD ∝ tn=1. Molecules whose diffusion is hindered by obstacles (D<1) or restricted to an area (confined) feature an MSD ∝ tn<1. Molecules going with a flow or being directionally transported show an MSD ∝ tn>1.
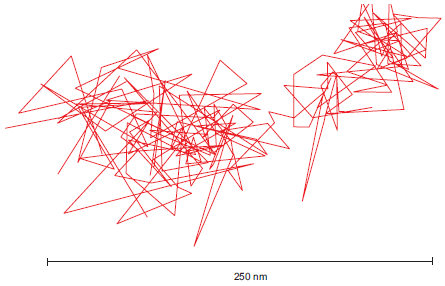
Figure 3b.Single molecule trace of an NTA-Atto 647 labeled serotonin receptor in the plasma membrane of a HEK293 cell (scale bar is 250 nm). 104 frames were recorded for this single molecule.
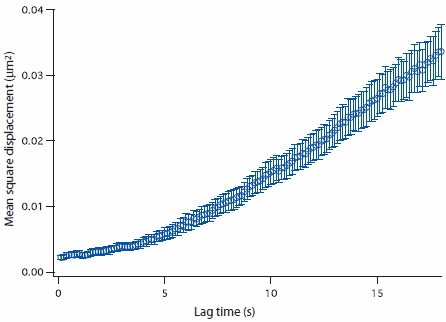
Figure 3c.Mean square displacement (MSD) of the trace shown in Figure 3B., indicating that this molecule undergoes free diffusional behavior.
To continue reading please sign in or create an account.
Don't Have An Account?