Skip to Content
MilliporeSigma
HomeSmall Molecule HPLCSelectivity Examination of Stationary Phases for HILIC

Selectivity Study of Stationary Phases for Hydrophilic Interaction Chromatography (HILIC) and Multivariate Analysis for Material Classification

C. Corman - Senior Research Scientist, A. Kumar - Senior Research Scientist

Abstract

Fifteen Hydrophilic Interaction Chromatography (HILIC) column phases were evaluated for their chromatographic properties.  Nine specific factors representing retention, hydrophilicity, hydrophobicity, shape selectivity, and ion exchange capabilities were investigated to characterize the phases. Their properties are visualized by spider web graphs and a phase clustering is done by multivariate analysis, and principal component analysis. This is a helpful tool for selecting phase chemistries for HILIC method development.

Section Overview

INTRODUCTION

The need for chromatographic materials to retain and separate polar and hydrophilic molecules is a continuously growing trend. A popular separation technique, Hydrophilic Interaction Chromatography, or HILIC as it is commonly abbreviated, is an excellent choice for the separation of these types of analytes. In this separation mode, analytes retain and elute based on a multitude of factors –partitioning into and from adsorbed water layer(s) of the hydrophilic stationary phase surface, ionic interactions with charged analytes, hydrogen bonding, dipole-dipole interactions, and adsorption in some cases. Due to the multifunctional nature of HILIC’s retention mechanisms, the choice of HILIC column stationary phase is very important.

Herein, we present a column classifying approach developed by Ikegami et al1 which gives information about retention and selectivity properties (summarized in Table 1) for HILIC phase chemistries. In addition, the multivariate analysis allowed for the clustering of stationary phases based on their chemical modification.
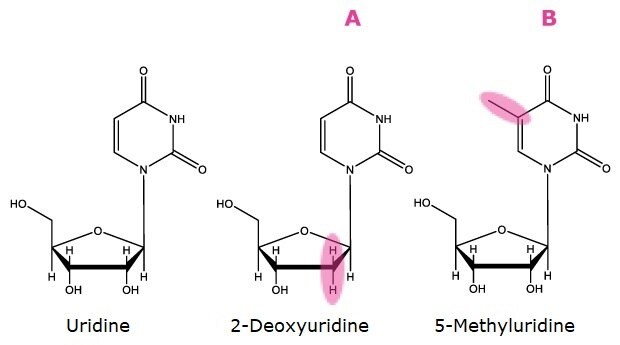
Table 1.Nine HILIC factors investigated for the test
Three compounds used as markers for hydrophobicity and hydrophilicity are shown. On the left is the chemical structure of uridine. In the middle is 2-deoxyuridine, with the second position on the furan ring highlighted in pink to indicate the absence of a hydroxyl group, labeled as A. On the right is 5-methyluridine, with the fifth carbon atom on the pyrimidine ring attached to the furan ring of the nucleoside highlighted in pink to indicate the presence of a methyl group, labeled as B.

Markers of Hydrophobicity/Hydrophilicity. A). Deoxygenated at 2 position, B). Addition of methyl group
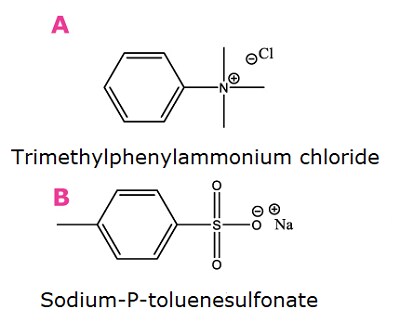
Two compounds used as markers for ion exchange are shown. On the top is the chemical structure of trimethylphenylammonium chloride, labeled A for cationic probe with positively charged nitrogen atom. Bottom shows the chemical structure of sodium-P-toluenesulfonate, labeled B for anionic probe with negatively charged oxygen.


Markers of ion exchange. A). Cationic probe, B). Anionic probe
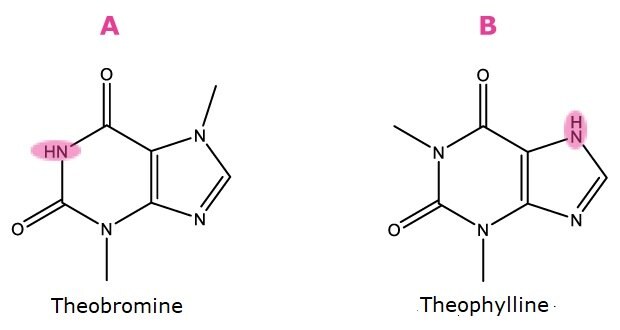
Two compounds used as markers for acidity/basicity are shown. On the left is the chemical structure of theobromine, featuring a six-membered ring fused with a five-membered ring. The NH group at the third position on the pyrimidine ring, next to the carbonyl group, is highlighted in pink to indicate the proton location with a pKa of 10, labeled A. On the right is the chemical structure of theophylline, with the NH group at the seventh position on the imidazole ring highlighted in pink to indicate the proton location with a pKa value of 8.6, labeled B.

Markers of acidity/basicity. A). Proton location, pKa ∼ 10, b). Proton location, pKa ∼ 8.6

The graphic depicts six compounds' chemical structures, which were utilized as shape selectivity markers. The first chemical on the left, called A, is adenosine, which has two OH groups connected to the second and third positions of the furan ring, highlighted in pink to show the cis position of the hydroxyl groups. The second molecule, labeled B, is vidarabine, which has OH groups in the trans position. The third molecule, labeled C, is 2-deoxyguanosine, with hydrogen atoms highlighted to indicate the lack of an OH group in the second position. The fourth molecule, labeled D, is 3-deoxyguanosine, with hydrogen atoms highlighted to indicate the lack of an OH group in the third position. The top right structure, labeled E, is 4-nitrophenyl-alpha-D-glucopyranoside, with the nitrophenyl group emphasized for its axial orientation,

Markers of shape selectivity. A). cis hydroxyl groups, B). trans hydroxyl groups, C). Deoxygenated at 2 and hydroxyl group at 3 position, D). Deoxygenated at 3 and hydroxyl group at 2 position, E) Axial nitrophenyl group, F). Equatorial nitrophenyl group

Figure 1. Compounds used as markers for HILIC factors as described in Table 1.
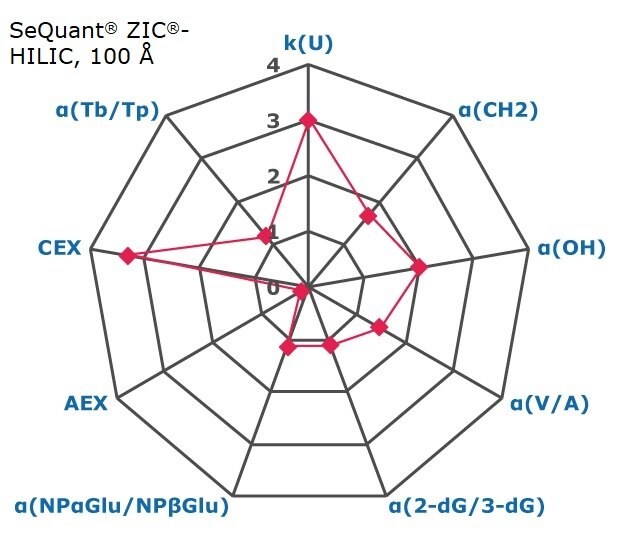
Table 2.Stationary phases evaluated for HILIC

EXPERIMENTAL CONDITIONS

RESULTS AND DISCUSSION

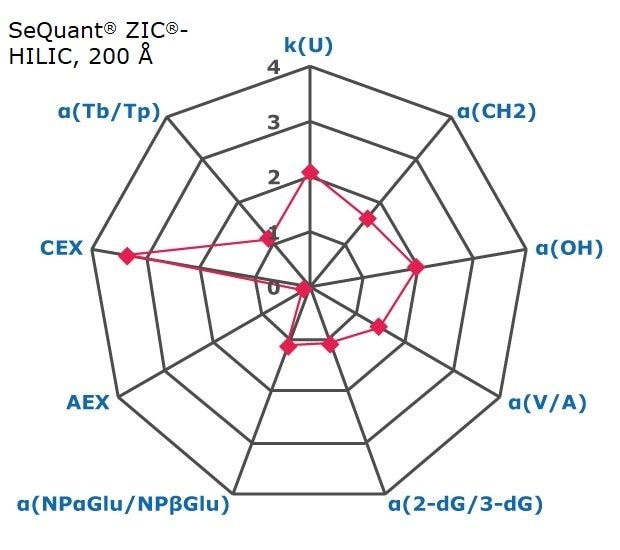
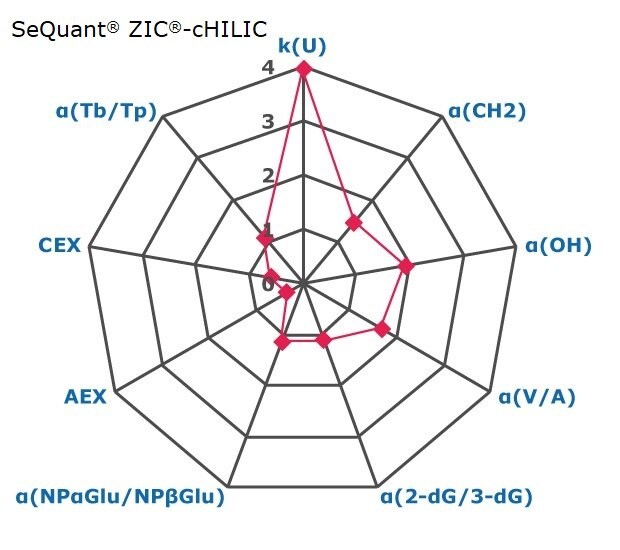
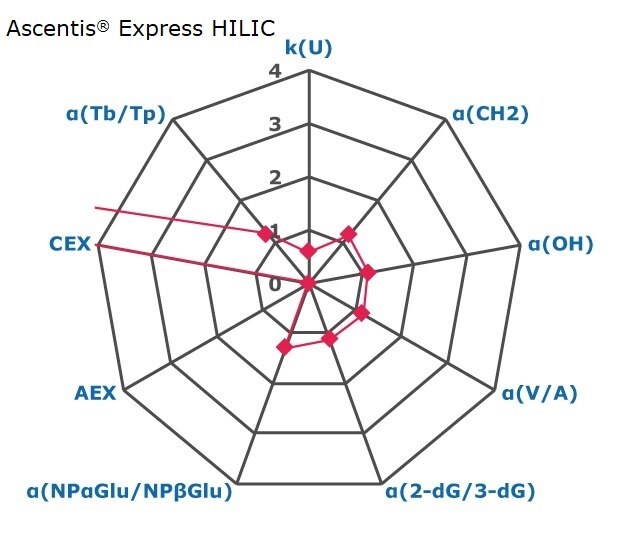
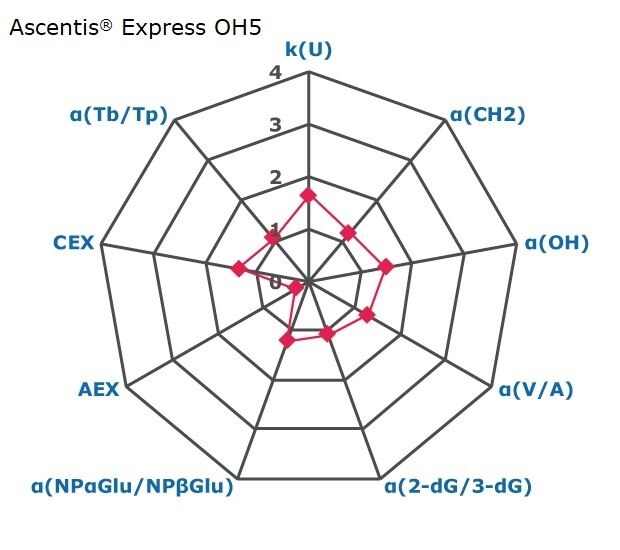
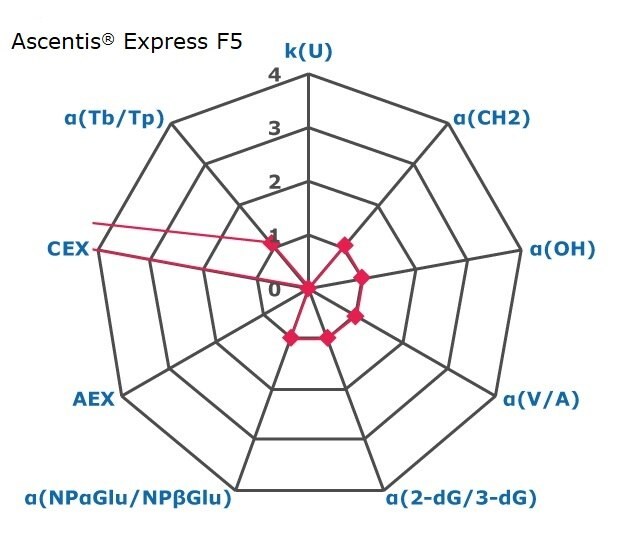
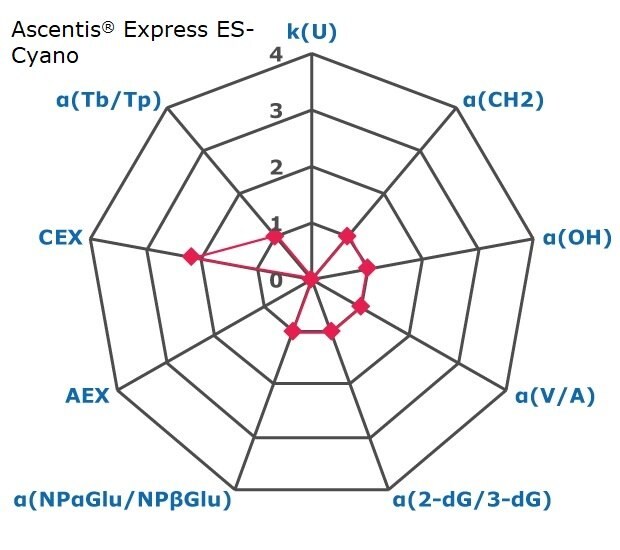
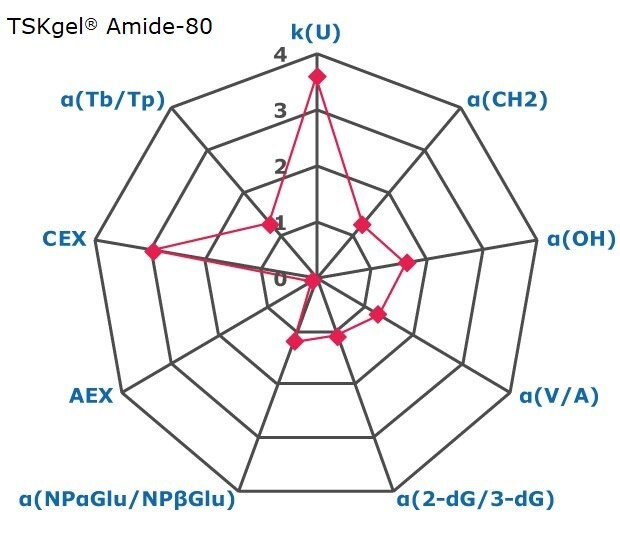
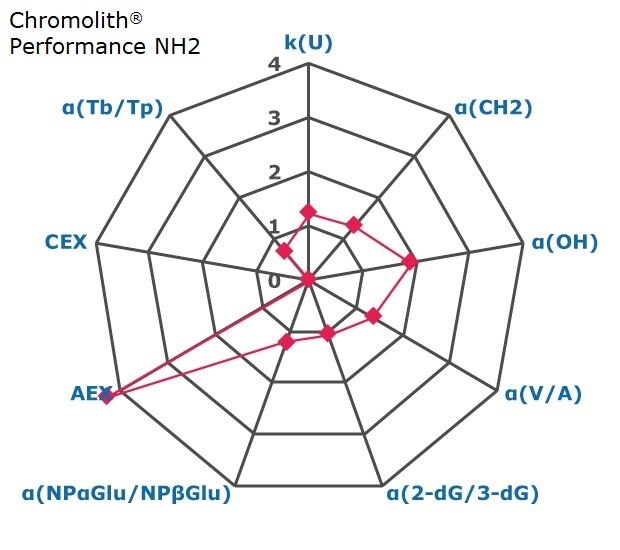
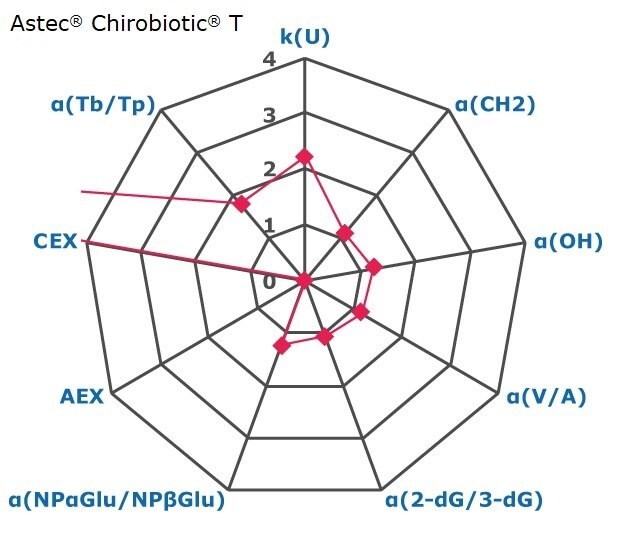
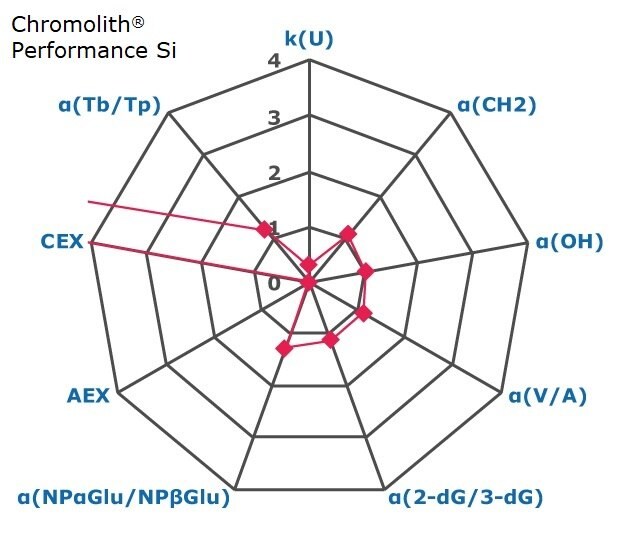
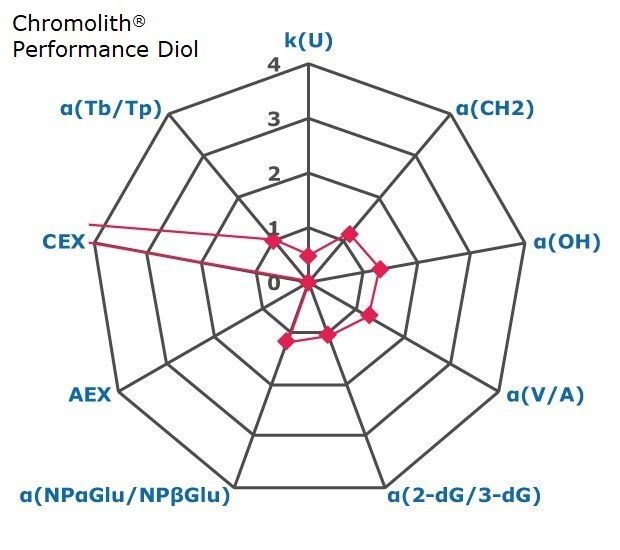
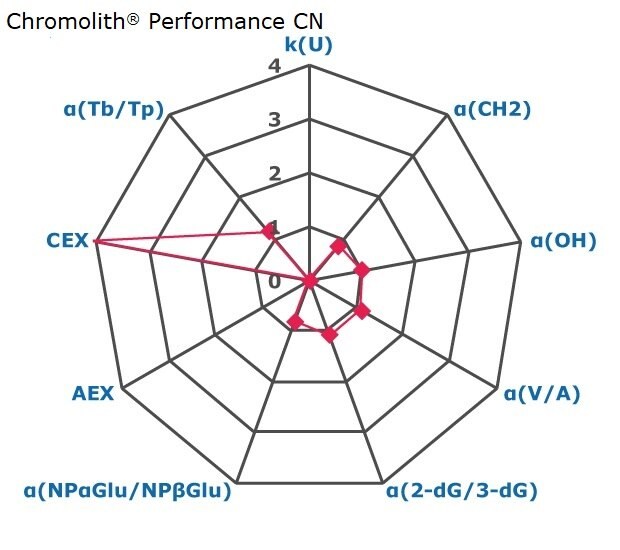
The results for the nine HILIC factor tests of the 15 investigated stationary phases are shown and visualized as spider web graphs in Figure 2. 

A radar chart with nine axes, each marked from 0 to 4, representing factors for chromatographic interactions such as retention, hydrophobicity, shape selectivity, anion exchange, cation exchange, and acidity/basicity. These factors provide an indication of the selectivity of a chromatography phase, specifically SeQuant® ZIC®-HILIC, 100 Å. The axes are labeled in blue as k(U), α(CH2), α(OH), α(V/A), α(2-dG/3-dG), α(NPαGlu/NPβGlu), AEX, CEX, and α(Tb/Tp) in a clockwise direction, with k(U) at the top. Small pink squares indicate data points on the axes: 3 for k(U), approximately 1.7 for α(CH2), 2 for α(OH), 1.5 for α(V/A), around 1.2 for both α(2-dG/3-dG) and α(NPαGlu/NPβGlu), around 0.2 for AEX, around 3.4 for CEX, and 1.3 for α(Tb/Tp). These points are connected to form a polygon, visually representing the data.
A radar chart with nine axes, each marked from 0 to 4, representing factors for chromatographic interactions such as retention, hydrophobicity, shape selectivity, anion exchange, cation exchange, and acidity/basicity. These factors provide an indication of the selectivity of a chromatography phase, specifically SeQuant® ZIC®-HILIC, 200 Å. The axes are labeled in blue as k(U), α(CH2), α(OH), α(V/A), α(2-dG/3-dG), α(NPαGlu/NPβGlu), AEX, CEX, and α(Tb/Tp) in a clockwise direction, with k(U) at the top. Small pink squares indicate data points on the axes: 2 for k(U), approximately 1.6 for α(CH2), 2 for α(OH), 1.5 for α(V/A), around 1.2 for both α(2-dG/3-dG) and α(NPαGlu/NPβGlu), around 0.1 for AEX, around 3.4 for CEX, and 1.2 for α(Tb/Tp). These points are connected to form a nine-sided polygon, visually representing the data.
The image is a radar chart with nine axes, each marked from 0 to 4, representing factors for chromatographic interactions such as retention, hydrophobicity, shape selectivity, anion exchange, cation exchange, and acidity/basicity. These factors provide an indication of the selectivity of a chromatography phase, specifically SeQuant® ZIC®-cHILIC. The axes are labeled in blue as k(U), α(CH2), α(OH), α(V/A), α(2-dG/3-dG), α(NPαGlu/NPβGlu), AEX, CEX, and α(Tb/Tp) in a clockwise direction, with k(U) at the top. Small pink squares indicate data points on the axes: 4 for k(U), approximately 1.5 for α(CH2), 2 for α(OH), 1.7 for α(V/A), around 1.2 for both α(2-dG/3-dG) and α(NPαGlu/NPβGlu), around 0.1 for AEX, around 0.5 for CEX, and 1.1 for α(Tb/Tp). These points are connected to form a nine-sided polygon, visually representing the data.
A radar chart with nine axes, each marked from 0 to 4, representing factors for chromatographic interactions such as retention, hydrophobicity, shape selectivity, anion exchange, cation exchange, and acidity/basicity. These factors provide an indication of the selectivity of a chromatography phase, specifically Ascentis® Express HILIC. The axes are labeled in blue as k(U), α(CH2), α(OH), α(V/A), α(2-dG/3-dG), α(NPαGlu/NPβGlu), AEX, CEX, and α(Tb/Tp) in a clockwise direction, with k(U) at the top. Small pink squares indicate data points on the axes: around 0.5 for k(U), approximately 1.2 for α(CH2), α(OH), and α(V/A), around 1.2 for α(2-dG/3-dG), approximately 1.3 for α(NPαGlu/NPβGlu), 0 for AEX, a value greater than 4 for CEX, and 1.1 for α(Tb/Tp). These points are connected, except for the data points for CEX and α(Tb/Tp), to form a nine-sided polygon, visually representing the data.
A radar chart with nine axes, each marked from 0 to 4, representing factors for chromatographic interactions such as retention, hydrophobicity, shape selectivity, anion exchange, cation exchange, and acidity/basicity. These factors provide an indication of the selectivity of a chromatography phase, specifically Ascentis® Express OH5. The axes are labeled in blue as k(U), α(CH2), α(OH), α(V/A), α(2-dG/3-dG), α(NPαGlu/NPβGlu), AEX, CEX, and α(Tb/Tp) in a clockwise direction, with k(U) at the top. Small pink squares indicate data points on the axes: around 1.7 for k(U), approximately 1.2 for α(CH2), 1.5 for α(OH), around 1.3 for α(V/A), around 1.2 for α(2-dG/3-dG), approximately 1.3 for α(NPαGlu/NPβGlu), around 0.2 for AEX, 1.5 for CEX, and 1.1 for α(Tb/Tp). These points are connected to nine-sided form a polygon, visually representing the data.
A radar chart with nine axes, each marked from 0 to 4, representing factors for chromatographic interactions such as retention, hydrophobicity, shape selectivity, anion exchange, cation exchange, and acidity/basicity. These factors provide an indication of the selectivity of a chromatography phase, specifically Ascentis® Express F5. The axes are labeled in blue as k(U), α(CH2), α(OH), α(V/A), α(2-dG/3-dG), α(NPαGlu/NPβGlu), AEX, CEX, and α(Tb/Tp) in a clockwise direction, with k(U) at the top. Small pink squares indicate data points on the axes: 0 for k(U), 1 for α(CH2), α(OH), and α(V/A), α(2-dG/3-dG), and α(NPαGlu/NPβGlu), 0 for AEX, a value greater than 4 for CEX, and 1.1 for α(Tb/Tp). These points are connected, except for the data points for CEX and α(Tb/Tp), to form a nine-sided open polygon, visually representing the data.
A radar chart with nine axes, each marked from 0 to 4, representing factors for chromatographic interactions such as retention, hydrophobicity, shape selectivity, anion exchange, cation exchange, and acidity/basicity. These factors provide an indication of the selectivity of a chromatography phase, specifically Ascentis® Express ES-Cyano. The axes are labeled in blue as k(U), α(CH2), α(OH), α(V/A), α(2-dG/3-dG), α(NPαGlu/NPβGlu), AEX, CEX, and α(Tb/Tp) in a clockwise direction, with k(U) at the top. Small pink squares indicate data points on the axes: 0 for k(U), 1 for α(CH2), α(OH), and α(V/A), α(2-dG/3-dG), and α(NPαGlu/NPβGlu), 0 for AEX, around 2.3 for CEX, and 1for α(Tb/Tp). These points are connected to form a nine-sided polygon, visually representing the data.
A radar chart with nine axes, each marked from 0 to 4, representing factors for chromatographic interactions such as retention, hydrophobicity, shape selectivity, anion exchange, cation exchange, and acidity/basicity. These factors provide an indication of the selectivity of a chromatography phase, specifically TSKgel® Amide-80. The axes are labeled in blue as k(U), α(CH2), α(OH), α(V/A), α(2-dG/3-dG), α(NPαGlu/NPβGlu), AEX, CEX, and α(Tb/Tp) in a clockwise direction, with k(U) at the top. Small pink squares indicate data points on the axes: around 3.7 for k(U), around 1.3 for α(CH2), around 1.7 for α(OH), around 1.4 for α(V/A), around 1.2 for α(2-dG/3-dG), around 1.3 for α(NPαGlu/NPβGlu), 0 for AEX, 3 for CEX, and around 1.3 for α(Tb/Tp). These points are connected to form a nine-sided polygon, visually representing the data.
A radar chart with nine axes, each marked from 0 to 4, representing factors for chromatographic interactions such as retention, hydrophobicity, shape selectivity, anion exchange, cation exchange, and acidity/basicity. These factors provide an indication of the selectivity of a chromatography phase, specifically Purospher® STAR NH2. The axes are labeled in blue as k(U), α(CH2), α(OH), α(V/A), α(2-dG/3-dG), α(NPαGlu/NPβGlu), AEX, CEX, and α(Tb/Tp) in a clockwise direction, with k(U) at the top. Small pink squares indicate data points on the axes: around 1.7 for k(U), around 1.2 for α(CH2), around 1.8 for α(OH), around 1.4 for α(V/A), around 1.2 for α(2-dG/3-dG), around 1.3 for α(NPαGlu/NPβGlu), more than 4 for AEX, 0 for CEX, and around 0.8 for α(Tb/Tp). These points are connected, except for α(NPαGlu/NPβGlu) and AEX, to form a nine-sided open polygon, visually representing the data.
A radar chart with nine axes, each marked from 0 to 4, representing factors for chromatographic interactions such as retention, hydrophobicity, shape selectivity, anion exchange, cation exchange, and acidity/basicity. These factors provide an indication of the selectivity of a chromatography phase, specifically Astec® Chirobiotic® T. The axes are labeled in blue as k(U), α(CH2), α(OH), α(V/A), α(2-dG/3-dG), α(NPαGlu/NPβGlu), AEX, CEX, and α(Tb/Tp) in a clockwise direction, with k(U) at the top. Small pink squares indicate data points on the axes: around 2.3 for k(U), around 1.2 for α(CH2), around 1.3 for α(OH), around 1.2 for α(V/A), around 1.1 for α(2-dG/3-dG), around 1.3 for α(NPαGlu/NPβGlu), 0 for AEX, more than 4 for CEX, and around 1.8 for α(Tb/Tp). These points are connected, except for CEX and α(Tb/Tp), to form a nine-sided open polygon, visually representing the data.
A radar chart with nine axes, each marked from 0 to 4, representing factors for chromatographic interactions such as retention, hydrophobicity, shape selectivity, anion exchange, cation exchange, and acidity/basicity. These factors provide an indication of the selectivity of a chromatography phase, specifically Chromolith® Perfomance Si. The axes are labeled in blue as k(U), α(CH2), α(OH), α(V/A), α(2-dG/3-dG), α(NPαGlu/NPβGlu), AEX, CEX, and α(Tb/Tp) in a clockwise direction, with k(U) at the top. Small pink squares indicate data points on the axes: around 0.4 for k(U), around 1.1 for α(CH2), 1 for α(OH), around 1.2 for α(V/A), around 1.3 for α(2-dG/3-dG), around 1.4 for α(NPαGlu/NPβGlu), 0 for AEX, more than 4 for CEX, and around 1.3 for α(Tb/Tp). These points are connected, except for CEX and α(Tb/Tp), to form a nine-sided open polygon, visually representing the data.
A radar chart with nine axes, each marked from 0 to 4, representing factors for chromatographic interactions such as retention, hydrophobicity, shape selectivity, anion exchange, cation exchange, and acidity/basicity. These factors provide an indication of the selectivity of a chromatography phase, specifically Chromolith® Perfomance Diol. The axes are labeled in blue as k(U), α(CH2), α(OH), α(V/A), α(2-dG/3-dG), α(NPαGlu/NPβGlu), AEX, CEX, and α(Tb/Tp) in a clockwise direction, with k(U) at the top. Small pink squares indicate data points on the axes: around 0.5 for k(U), around 1.1 for α(CH2), around 1.3 for α(OH), around 1.3 for α(V/A), around 1.1 for α(2-dG/3-dG), around 1.2 for α(NPαGlu/NPβGlu), 0 for AEX, more than 4 for CEX, and 1 for α(Tb/Tp). These points are connected, except for CEX and α(Tb/Tp), to form a nine-sided open polygon, visually representing the data.
A radar chart with nine axes, each marked from 0 to 4, representing factors for chromatographic interactions such as retention, hydrophobicity, shape selectivity, anion exchange, cation exchange, and acidity/basicity. These factors provide an indication of the selectivity of a chromatography phase, specifically Chromolith® Perfomance NH2. The axes are labeled in blue as k(U), α(CH2), α(OH), α(V/A), α(2-dG/3-dG), α(NPαGlu/NPβGlu), AEX, CEX, and α(Tb/Tp) in a clockwise direction, with k(U) at the top. Small pink squares indicate data points on the axes: around 1.3 for k(U), around 1.4 for α(CH2), around 1.9 for α(OH), around 1.3 for α(V/A), around 1.1 for α(2-dG/3-dG), around 1.2 for α(NPαGlu/NPβGlu), around 4.4 for AEX, 0 for CEX, and around 0.7 for α(Tb/Tp). These points are connected to form a nine-sided closed polygon, visually representing the data.
A radar chart with nine axes, each marked from 0 to 4, representing factors for chromatographic interactions such as retention, hydrophobicity, shape selectivity, anion exchange, cation exchange, and acidity/basicity. These factors provide an indication of the selectivity of a chromatography phase, specifically Chromolith® Perfomance CN. The axes are labeled in blue as k(U), α(CH2), α(OH), α(V/A), α(2-dG/3-dG), α(NPαGlu/NPβGlu), AEX, CEX, and α(Tb/Tp) in a clockwise direction, with k(U) at the top. Small pink squares indicate data points on the axes: 0 for k(U), around 0.8 for α(CH2), 1 for α(OH), around 1.1 for α(V/A), and α(2-dG/3-dG), around 0.8 for α(NPαGlu/NPβGlu), 0 for AEX, 4 for CEX, and around 1.2 for α(Tb/Tp). These points are connected to form a nine-sided closed polygon, visually representing the data.
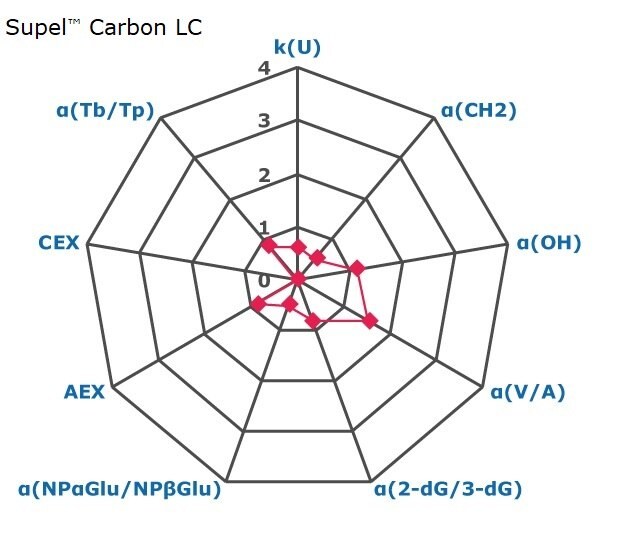
A radar chart with nine axes, each marked from 0 to 4, representing factors for chromatographic interactions such as retention, hydrophobicity, shape selectivity, anion exchange, cation exchange, and acidity/basicity. These factors provide an indication of the selectivity of a chromatography phase, specifically Supel™ Carbon LC. The axes are labeled in blue as k(U), α(CH2), α(OH), α(V/A), α(2-dG/3-dG), α(NPαGlu/NPβGlu), AEX, CEX, and α(Tb/Tp) in a clockwise direction, with k(U) at the top. Small pink squares indicate data points on the axes: around 0.7 for k(U), around 0.5 for α(CH2), around 1.1 for α(OH), around 1.5 for α(V/A), 0.8 for α(2-dG/3-dG), around 0.5 for α(NPαGlu/NPβGlu), 0.9 for AEX, 0 for CEX, and around 0.9 for α(Tb/Tp). These points are connected to form a nine-sided closed polygon, visually representing the data.

Figure 2. Results on HILIC factors for 15 stationary phases.

Some general findings from the evaluated stationary phases could be broken up into two main categories:

  • Phases with weak ion-exchange mechanisms, but strong retention of neutral hydrophilic probes – Zwitterionic and Amide phases.
  • Phases with predominantly ion-exchange mechanisms and weak or no retention towards the neutral hydrophilic probes - Bare silica, pentafluorophenyl, cyano, diol, and amine phases.

In Figure 3 the phases are graphically positioned relatively to each other for their strength in hydrophilic and ion exchange retentivity. For Hydrophilic Retention the cyano, fluoro, and carbon phases show the least retention while the zwitter ionic and amide phases the most. It should be noted that the Carbon LC (PGC) is typically operated under RP conditions to retain highly polar compounds. The here for comparability chosen unified HILIC mobile phase conditions are not the optimal for operating this phase type. The PGC column was also the shortest (5 cm) in this comparison. Hence results under RP conditions and a longer column will differ.

Regarding ion-exchange retention the amine phases showed strongest anion exchange followed by the carbon phase, while bare silica, fluoro and tecoplanin, diol, cyano phases stronger cation exchange. Zwitter ionic are more balanced towards in the middle for ionic retention with slight trend to cation exchange.   

a gradient chart titled "Hydrophilic Retention," designed to illustrate the varying degrees of hydrophilic retention across different substances. On the left side, labeled "Least," are Fluoro, Cyano, and PGC, indicating low hydrophilic retention. Moving towards the center, the substances listed are Bare Silica, Diol, Amine, and OH5, which have moderate hydrophilic retention. On the right side, labeled "Most," are Teicoplanin, Zwitterionic, and Amide, representing the highest levels of hydrophilic retention. The background of the chart transitions from white on the left to light blue on the right, visually reinforcing the gradient of hydrophilic retention from least to most.
a gradient chart titled "Ion-Exchange Retention," illustrating the range of ion-exchange retention capabilities of different substances. The chart spans from "Strong Anion Exchange" on the left to "Strong Cation Exchange" on the right. On the left side, indicating strong anion exchange, are Amine and PGC. In the middle, representing moderate ion-exchange retention, are Zwitterionic, OH5, Amide, and Teicoplanin. On the right side, indicating strong cation exchange, are Cyano, Bare Silica, Diol, and Fluoro. The background transitions from a light yellow on the left to a light green on the right, visually depicting the gradient from strong anion to strong cation exchange.

Figure 3. Comparison of hydrophilic and ion exchange retention properties of investigated HILIC phases.

In terms of overall selectivity, the zwitterionic stationary phases are the most comprehensive. For this reason, the use of zwitterionic columns is highly recommended as a good starting point for method development. However, if mainly ionizable analytes will be present, use columns with strong ion-exchange mechanisms. Typically, when ion exchange is present it tends to be the dominant retention mechanism. Bare silica columns and pentafluorophenyl phases are a sensible choice for cation exchange while amine phases are well suited for anion exchange. Curiously, the porous graphitic carbon phase also demonstrates anion exchange properties.

The use of multivariate analysis, principal component analysis (PCA), was performed using Minitab software for further characterization of the stationary phases (Figure 4). This resulted in the clustering of the data set which could then be grouped by their chemical modification. Although the use of PCA may not be necessary for general method development purposes, it has been extremely useful in the classification of new HILIC materials.

The score plot illustrates the results of a Principal Component Analysis (PCA) of 15 evaluated HILIC phases, showing the distribution of various stationary phases used in hydrophilic interaction liquid chromatography (HILIC). The x-axis (PC1), accounting for 40.8% of the variance, ranges from +3.5 to -3.5, while the y-axis (PC2), accounting for 29.8% of the variance, extends from -3 to +4. The two axes intersect at the origin (0,0), dividing the plot into four quadrants. Distinct clusters represent different stationary phases. In the top-left quadrant, a black dot denotes the porous graphitic carbon phase at approximately (-3.5, 3.5). The Cyano phase, represented by two orange dots and encircled in an orange sphere, clusters around (-2.5, 0.2). The Fluoro phase, indicated by a blue dot, slightly overlaps with the Cyano cluster at approximately (-2.5, -0.4). The Alcohol phase is represented by two green dots near the origin, around (-0.5, 0) and (0.5, 0), enclosed within a green circle. In the upper-right quadrant, the amine phase is depicted by two red dots at around (1.5, 2). The Zwitterionic phase forms an elongated purple cluster on the right side of the plot, stretching from about (0, 2.5) to (2.6, 0.8), showing positive values on both PC1 and PC2, with a broad spread along the PC2 axis. The Amide phase is indicated by a blue dot in the right-middle section near (1.5, 0.5), with a positive PC2 value and a negative PC1 value. The Bare Silica phase, represented by two pink dots, is located in the lower-left quadrant around (-0.5, -2) and (-1.5, -3), showing negative values on both axes. Lastly, the Teicoplanin phase, marked by a cyan dot, is positioned slightly left of the origin at approximately (-0.2, -2), also with negative values on both PC1 and PC2.

Figure 4.PCA score plot of the 15 evaluated HILIC phases.

CONCLUSION

Fifteen stationary phase materials were characterized for HILIC. The testing methodology shown has been useful for the initial screening of HILIC materials. By and large, the sorbents could be classified as phases that demonstrate strong hydrophilic retention or phases with weak retention properties but strong ion exchange retention. With this in mind, it is recommended to have a set of three to four columns when screening for HILIC method development – zwitterionic, bare silica, amine, and amide phases. Details about analyte properties (logD, pKa, charge state, etc.) will give further intuition as to what column chemistry is reasonable to start with first. Furthermore, characterization with multivariate tools was shown as an effective approach to classify materials based on their chemical modification.

Example chromatograms for HILIC Applications

Related Products
Loading

References

1.
Kawachi Y, Ikegami T, Takubo H, Ikegami Y, Miyamoto M, Tanaka N. 2011. Chromatographic characterization of hydrophilic interaction liquid chromatography stationary phases: Hydrophilicity, charge effects, structural selectivity, and separation efficiency. Journal of Chromatography A. 1218(35):5903-5919. https://doi.org/10.1016/j.chroma.2011.06.048
Sign In To Continue

To continue reading please sign in or create an account.

Don't Have An Account?