Analysis of Pesticide Residues in Food of Plant Origin by QuEChERS and GC-MS acc. to GB 23200.113-2018
Jack Wang
R&D APAC lab, Shanghai, China
Abstract
This work describes the development of a method for the simultaneous determination of pesticides (208) and their metabolites in plant-derived food by gas chromatography-tandem mass spectrometry (GC-MS/MS) according to the Chinese GB 23200.113-2018 standard method. After QuEChERS extraction and cleanup, sample analysis was conducted by GC-MS/MS in dynamic multiple reaction monitoring mode, and an external matrix-matched standard calibration method was used for analyte quantification. All pesticide residues displayed excellent linearity in the range of 0.01-0.5 mg/L with correlation coefficients >0.9980. Recoveries were ranging from 67.2%-108%, relative standard deviations (RSD) were 3.5-8.5%, and the limit of quantification was <10 μg/kg. The method therefore met the criteria of the GB 23200.113-2018 and can be utilized for the detection and analysis of pesticides and pesticide metabolites in plant-derived food.
Section Overview
Introduction
Pesticides are used to protect crops from disease or pests during production, storage, and transportation. Their residues in or on the surface of commodities such as vegetables, fruits, herbs, honey, cereals, or other foods of plant origin can also cause, due to their potential toxicity, adverse health effects and environmental issues. Therefore, many national and international organizations have issued guidelines and limits, e.g. the European Union (EU) has developed and published policy statements to guide agricultural organizations on the proper use of pesticides 1. For example, under EU regulations, maximum residue limits (MRLs) refer to the maximum legally permissible level of pesticide residues in or on the surface of food or animal feed when pesticides are used.2 The residues in food must be as low as possible, ensuring food safety for the consumers. This indicates the need for highly sensitive methods for the analysis of multi-residue pesticides in food substrates.
In recent years, the QuEChERS method (quick, easy, cheap, effective, rugged and safe), has become a commonly adopted fast sample preparation technique for agricultural products. The QuEChERS approach was published in 2003 by Lehotay and Anastassiades3, and it got formalized in official methods such as the AOAC.2007.01 and the EN 15662. The principle of this technique is that homogenized samples are extracted with acetonitrile (or acidified acetonitrile) and then salted out with extraction salts. After agitation and centrifugation, the acetonitrile supernatant is subjected to cleanup using bulk SPE adsorbents such as primary secondary amine functionalized silica (PSA, e.g., n-propylethylenediamine) and other adsorbents, depending on the food matrix. The adsorbents bind most of the sample interferences from the matrix (organic acids, fatty acids, fats, carbohydrates, pigments etc.), and are removed from the sample by subsequent centrifugation. The resulting supernatant is then subjected to GC or LC analysis.
The State Administration for Market Regulation of China introduced the QuEChERS sample preparation method into a National Standard first in the new GB 23200.113-2018.4 The GB 23200.113-2018 combines QuEChERS with GC-MS/MS analysis for the efficient determination of pesticide residues in plant-derived food. They can be applied for the rapid and accurate identification and quantification of target compounds in complex substrates and reduce manual lab work. According to the National Standard GB 23200.113-2018, the described method can be applied to analyze 23 sample substrates of nine categories of plant-derived food, including vegetables, fruits, fungi, cereals, legumes, oil crops, tea, spices, or vegetable oils.
In this work, a set of 208 pesticides and their metabolites, including organophosphorus compounds, organochlorines, pyrethroids, triazoles, amides, triazines, phenoxycarboxylic acids and carbamates, were analyzed in a fruit sample (apple) following the GB method.
Experimental-Pesticide Analysis by GC-MS
Standard, Sample, and Reagent Preparation
Analyzed Samples
Weigh 500 g of an apple sample, chop and mix thoroughly. Sample by the quartering method or homogenize in a tissue masher and store in polyethylene bottles.
Solvent Preparation
- Extraction Solvent: Add 10 mL acetic acid to 990 mL acetonitrile and mix well to obtain a solution of 1% acetic acid in acetonitrile (99:1, v:v).
Preparation of Pesticide Standards
- Pesticide stock solution I (10.0 µg/mL): Transfer 1 mL of a standard mixture of 208 pesticides and their metabolites (concentration: 100 µg/mL) into a 10 mL amber glass volumetric flask and fill up to the mark with ethyl acetate. Store the standard solution at 0°C–4°C and protected from light. The pesticide and metabolite concentration in the resulting stock solution is 10.0 µg/mL.
- Pesticide stock solution II (1 µg/mL): Pipette 1 mL of pesticide stock solution I into a 10 mL amber glass volumetric flask and fill up to the mark with ethyl acetate to obtain a pesticide stock solution II with a pesticide/metabolite concentration of 1.0 µg/mL. Store at 0°C–4°C and protected from light.
- Pesticide standard solutions 1-5: Prepare a total of five standard working solutions (nos. 1-5) by pipetting 10 μL, 50 μL, 100 μL, 300 μL, and 500 μL of pesticide stock solution II into five separate 1 mL vials. Fill vials up to the mark with blank apple matrix extract solution. The concentrations of the pesticides in the resulting solutions are 10.0, 50.0, 100, 300, and 500 μg/L, respectively.
- Internal standard solution Heptachloride B I (1.0 mg/mL): 10 mg Heptachloride B (accurate to 0.1 mg) was weighed and dissolved in ethyl acetate, transferred to a 10 mL amber glass volumetric flask, and filled up to the mark with ethyl acetate. at constant volume to form an internal standard reserve solution with a resulting Heptachloride B of 1.00 mg/mL.
- Internal standard solution Heptachloride B II (5.00 mg/L): Pipette 0.05 mL of internal standard solution Heptachloride B I into a 10 mL amber glass volumetric flask and fill up to the mark with ethyl acetate to obtain an internal standard solution Heptachloride B II with a Heptachloride B concentration of 5.00 µg/mL or mg/L. Store at 0 °C – 4 °C.
Sample Preparation
- Extraction: Weigh 10 g of an apple sample (fresh) into a 50 mL plastic centrifuge tube, and add 10 mL of 1% acetic acid in acetonitrile and the content of one SupelTM QuE Citrate Extraction Tube (55227-U) , containing 4 g of magnesium sulfate, 1 g of sodium chloride, 1 g of trisodium citrate, and 0.5 g of disodium hydrogen citrate). Shake centrifuge tube vigorously for 1 min and centrifuge at 4200 rpm for 5 min.
- Cleanup: Add 6 mL of the supernatant to a 15 mL Supel™ QuE PSA/ENVI-Carb Tube 1 (55446-U), containing 15 mg Supelclean™ ENVI-Carb, 150 mg Supelclean™ PSA, and 900 mg magnesium sulfate), vortex for 1 min. Centrifuge at 4200 rpm for 5 min, transfer 2 mL of the supernatant into a 10 mL test tube, and evaporate almost to complete dryness under nitrogen flow in a water bath at 40 °C. Then add 20 μL of the internal standard solution of Heptachloride B II and redissolve with 1 mL of ethyl acetate. Filter the resulting solution using a 0.22 μm microporous filtration membrane.
- Spiking experiments: Prepare two samples for the determination of recovery and precision by mixing 10.0 g of blank sample with 1000 μL and 2000 μL of pesticide stock solution II, respectively. The concentrations of the pesticides in the two resulting samples are 100 µg/kg and 200 µg/kg, respectively.
Use the sample with a pesticide concentration of 200 µg/kg for the determination of analysis precision (% RSD), and the sample with a pesticide concentration of 100 µg/kg for the analysis of the recovery rate (%).
GC-MS Analysis
The samples were analyzed using the GC parameters shown in Tables 1 & 2 using the MRM transition as described in the GB method.
Results & Discussion
Apple samples were prepared by the QuEChERS technique, using citrate buffered extraction (Supel™ QuE Citrate Extraction Tube, 55227-U) and cleanup by PSA/Carbon (Supel™ QuE PSA/ENVI-Carb Tube 1, 55446-U). The extracts were then analyzed by GC-MS/MS (operated in multi-reaction monitoring mode) and quantified by an external matrix-matched calibration approach. The method was applied for the determination of 208 pesticide residues in apple samples.
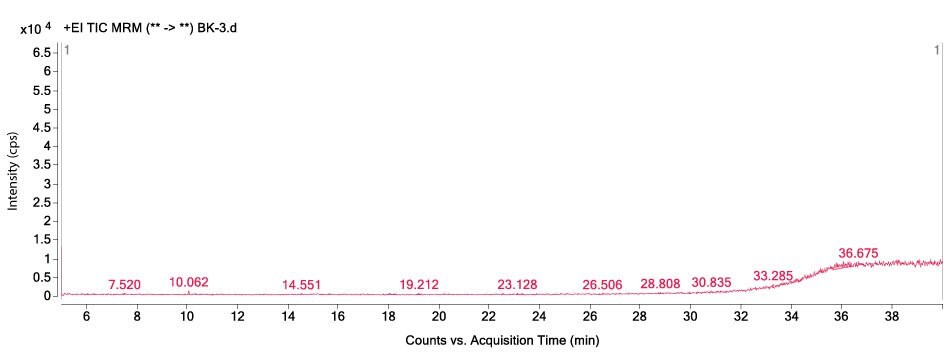
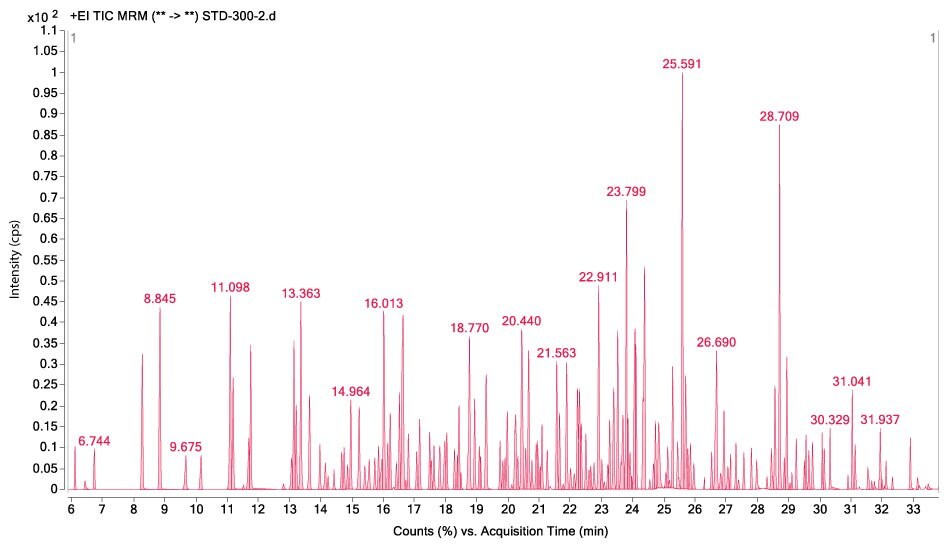
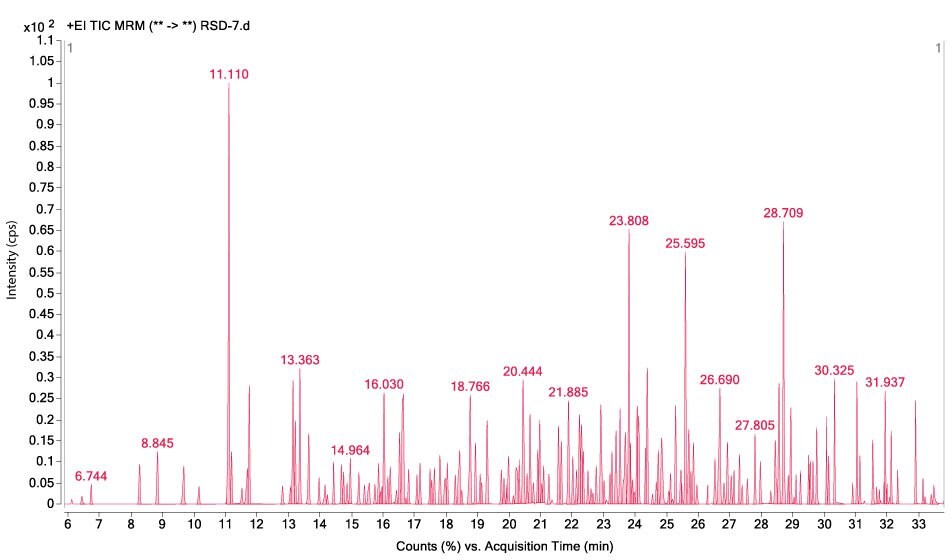
Figures 1-3 show MRM chromatograms of an unspiked apple sample, the pesticide standard solution 4 (c = 300 µg/L), and an apple sample spiked at 100 µg/kg.

Figure 1. GC-MS/MS chromatogram obtained by the analysis of an unspiked apple sample.

Figure 2.GC-MS/MS chromatogram displaying the analysis of pesticide standard solution 4 (c = 300 μg/L).

Figure 3.GC-MS/MS chromatogram obtained by the analysis of an apple sample spiked at a level of 100 µg/kg for all 208 pesticides.
Calibration
The calibration experiments using pesticide standard solutions 1-5 (analytes in blank apple matrix extract at 10-500 µg/L). The correlation coefficients R2 of the pesticides ranged from 0.9874 to 0.9999, meeting the GB method’s requirement >0.9950. Figure 4 and Table 3 show, as an example, the calibration curve and determined area counts for acetochlor. Limits of quantification (LOQ) were for all pesticides below 10 µg/L as required.

Figure 4.Calibration curve example (acetochlor).
Data Precision and Recovery (%)
For the determination of the precision of the analysis, the sample spiked at a pesticide concentration of 200 µg/kg was used. The precision for all 208 pesticides ranged from 1.41 to 8.53 %RSD (GB criteria <15%). The analysis of the recovery rate (%) was performed utilizing the sample spiked at a concentration of 100 µg/kg. The recovery ranged from 67.2% to 108% (GB criteria 60-120%).
As examples are in Tables 4 & 5, results for 5 pesticides from the list of pesticide compounds given by GB method are shown.
Suitability Criteria Summary
In Table 6 a summarized overview of the suitability criteria of the GB method and the determined values is provided, showing that the developed method complies with the GB 23200.113-2018.
Conclusion
The new GB 23200.113-2018 is the first national standard in China that combines QuEChERS sample preparation with GC-MS/MS analysis, allowing a rapid and accurate determination of multiple residues in complex substrates such as plant-derived food (23 sample substrates covered).
This work describes pesticide residue analysis following their QuEChERS-based extraction and clean-up. A set of 208 pesticides and their metabolites, including organophosphorus compounds, organochlorines, pyrethroids, triazoles, amides, triazines, phenoxycarboxylic acids, and carbamates, were analyzed in a fruit sample (apple) according to the GB standard using Supel™ QuE QuEChERS mixes.
All investigated compounds displayed excellent linearity in the range of 0.01 to 0.5 mg/L (matrix-matched standard curve specified by GB method) with correlation coefficients >0.9980, meeting the requirement of >0.995. Recoveries were ranging from 67.2% to 108%, and relative standard deviations (RSD) were 1.41% to 8.53%, both meeting the criteria of the GB standard. LOQs were for all compounds lower than 10 µg/kg as required by the GB method. It was demonstrated that the displayed method can be utilized for the detection and analysis of pesticides and pesticide metabolites in plant-derived food according to GB 23200.113-2018 with high accuracy and reliability.
See more applications on Food & Beverage Testing.
References
To continue reading please sign in or create an account.
Don't Have An Account?